
FIGURE 2.
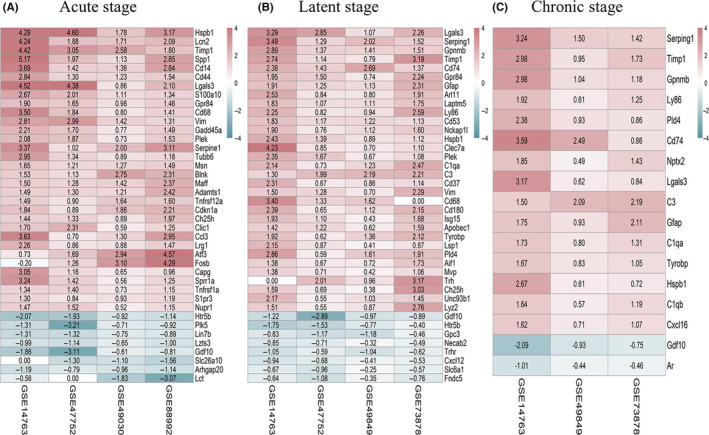
The robust differentially expressed genes (DEGs) obtained by integrating multiple microarrays using robust rank aggregation (RRA) algorithm in three stages of epilepsy. RRA algorithm assigned P‐value and log2 |fold change (FC)| to each gene and ranked the genes by the assigned P‐value. Genes with the Bonferroni‐adjusted P‐value <0.05 and |log2 FC|>0.5 were strictly kept in the final aggregated lists as the robust DEGs. (A‐C): Heat maps of the top up‐ and down‐regulated DEGs in the final aggregated lists identified by RRA analysis in the acute, latent, and chronic stages. The top 32 up‐regulated and 8 down‐regulated RRA genes in the acute and latent stages and all RRA genes in the chronic stage were displayed. Red represents up‐regulated genes, while blue represents down‐regulated genes. The depth of the color represents the size of the log2 FC