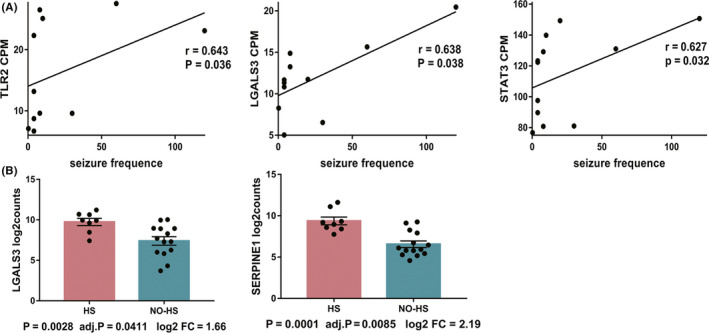
FIGURE 5.

The hub genes associated with seizure frequency and hippocampal sclerosis in patients with temporal lobe epilepsy (TLE). A. Scatter plots showing the correlations between hub genes and seizure frequency in TLE patients in GSE127871. r = Spearman's rank correlation coefficient between the cpm of genes and seizure frequencies. The dark lines are the regression lines fitted by linear modeling. B. Barplots showing the differential expression of hub genes analyzed by DESeq2 package between the no‐HS and HS groups in TLE patients in GSE71058. Bottom of each plot showing the P‐values, FDR‐adjusted P‐value, and log2 (fold change (FC)) of genes
