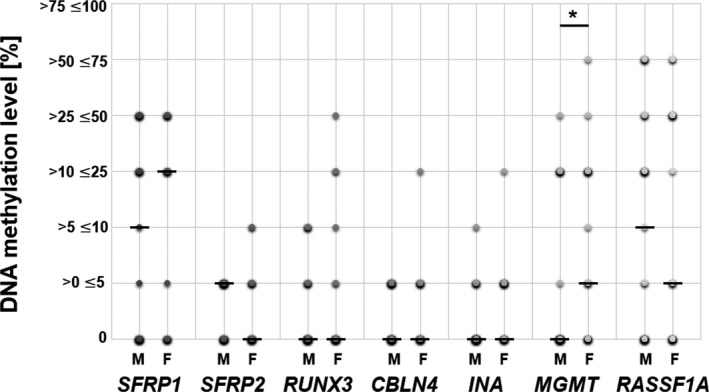
FIGURE 3.

DNA methylation level [%] of the analyzed 7‐gene panel in relation to patients’ gender. M indicates male, F—female. The size and color intensity of each dot indicates the number of samples representing the particular methylation range. Median is indicated with a horizontal line "–". MGMT promoter methylation level is significantly higher in female patients, as compared to the value in males (P < 0.05)
