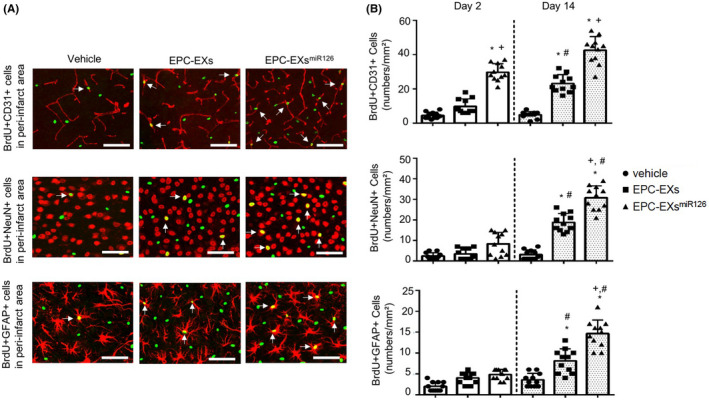
Figure 6.

The effects of EPC‐EXsmiR126 on angiogenesis and neurogenesis following ischemic stroke in diabetic mice. A: Representative images of angiogenesis (BrdU+/CD31 + cells) and neurogenesis (BrdU+/NeuN+ and BrdU+/GFAP + cells) on day 14. Arrows indicate the co‐localization of BrdU with endothelial cells, neurons, and astrocytes. Scale bars: 80 µm for BrdU+/CD31+; 40 µm for BrdU+/NeuN+ and BrdU+/GFAP+. B: Summarized data on angiogenesis and neurogenesis. *P < 0.05 vs vehicle; # P < 0.05 vs Day 2; + P < 0.05 vs EPC‐EXs; n = 11/group. Data are displayed as mean ± SD
