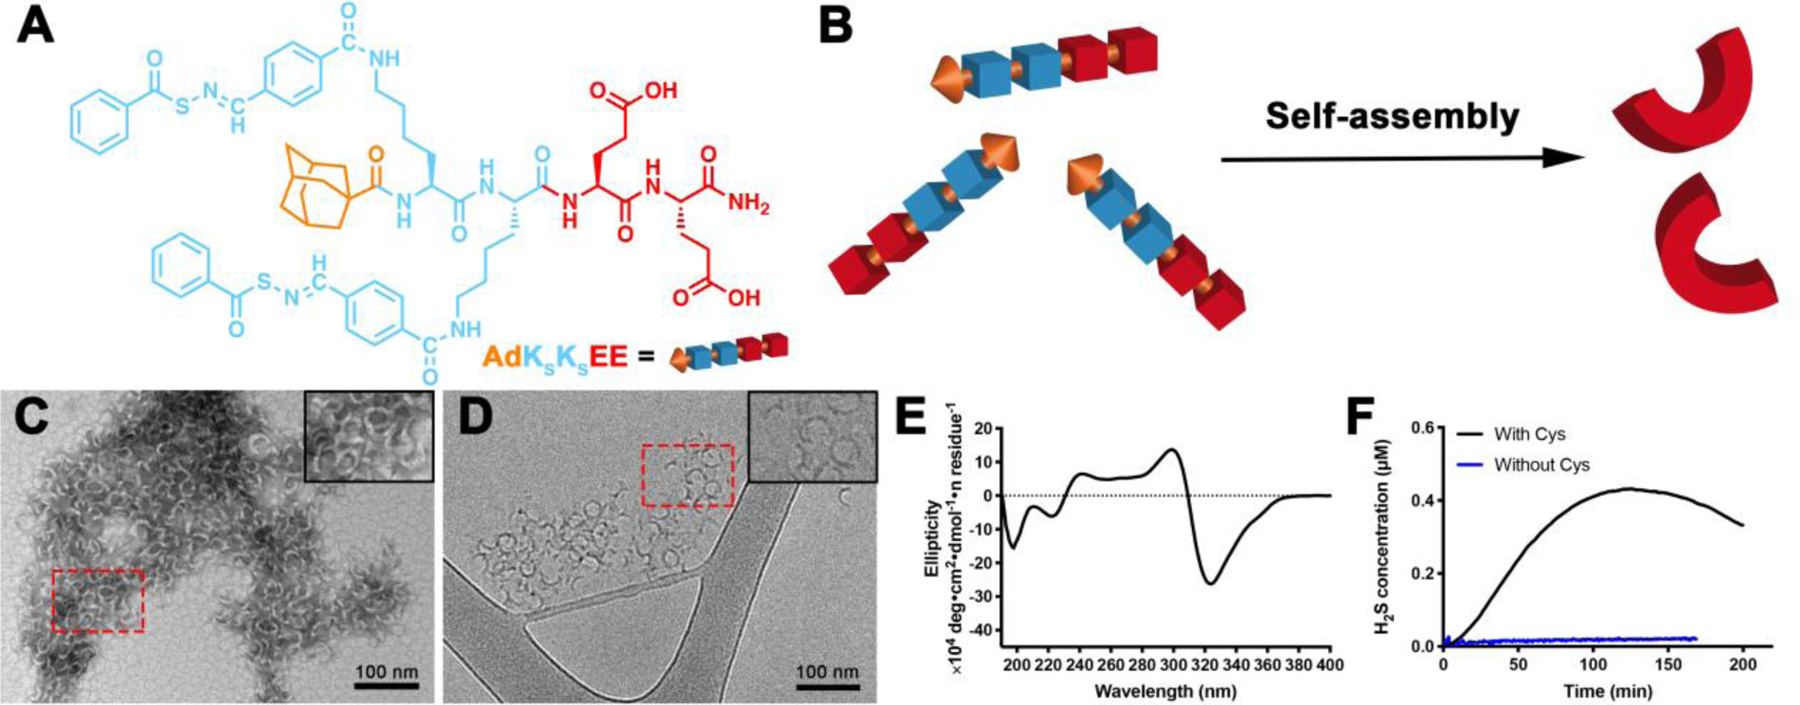
Figure 1.

(A) Molecular structure of PHDC AdKSKSEE. (B) Schematic illustration showing self-assembly of AdKSKSEE in aqueous solution. (C) Representative conventional TEM micrograph (stained with uranyl acetate, UA), and (D) representative cryo-TEM micrograph of crescent nanostructures formed by PHDC AdKSKSEE in phosphate buffer (PB, 10 mM pH 7.4) at 1 mM. Insets in the top right corners of panels C and D show zoomed-in images of the areas outlined by the dashed red rectangles. (E) CD spectrum of AdKSKSEE in PB at 100 μM; (F) H2S release profiles of AdKSKSEE triggered by Cys or without Cys in PB at rt. Data were collected on an H2S-sensitive electrochemical probe from a solution of PHDC (1 mM) and Cys (4 mM) sealed in a well with a gas-permeable membrane inside a vial containing PB (5 mL). Experiments were repeated three times for each PHDC, and data shown reflect averages of the three runs.
