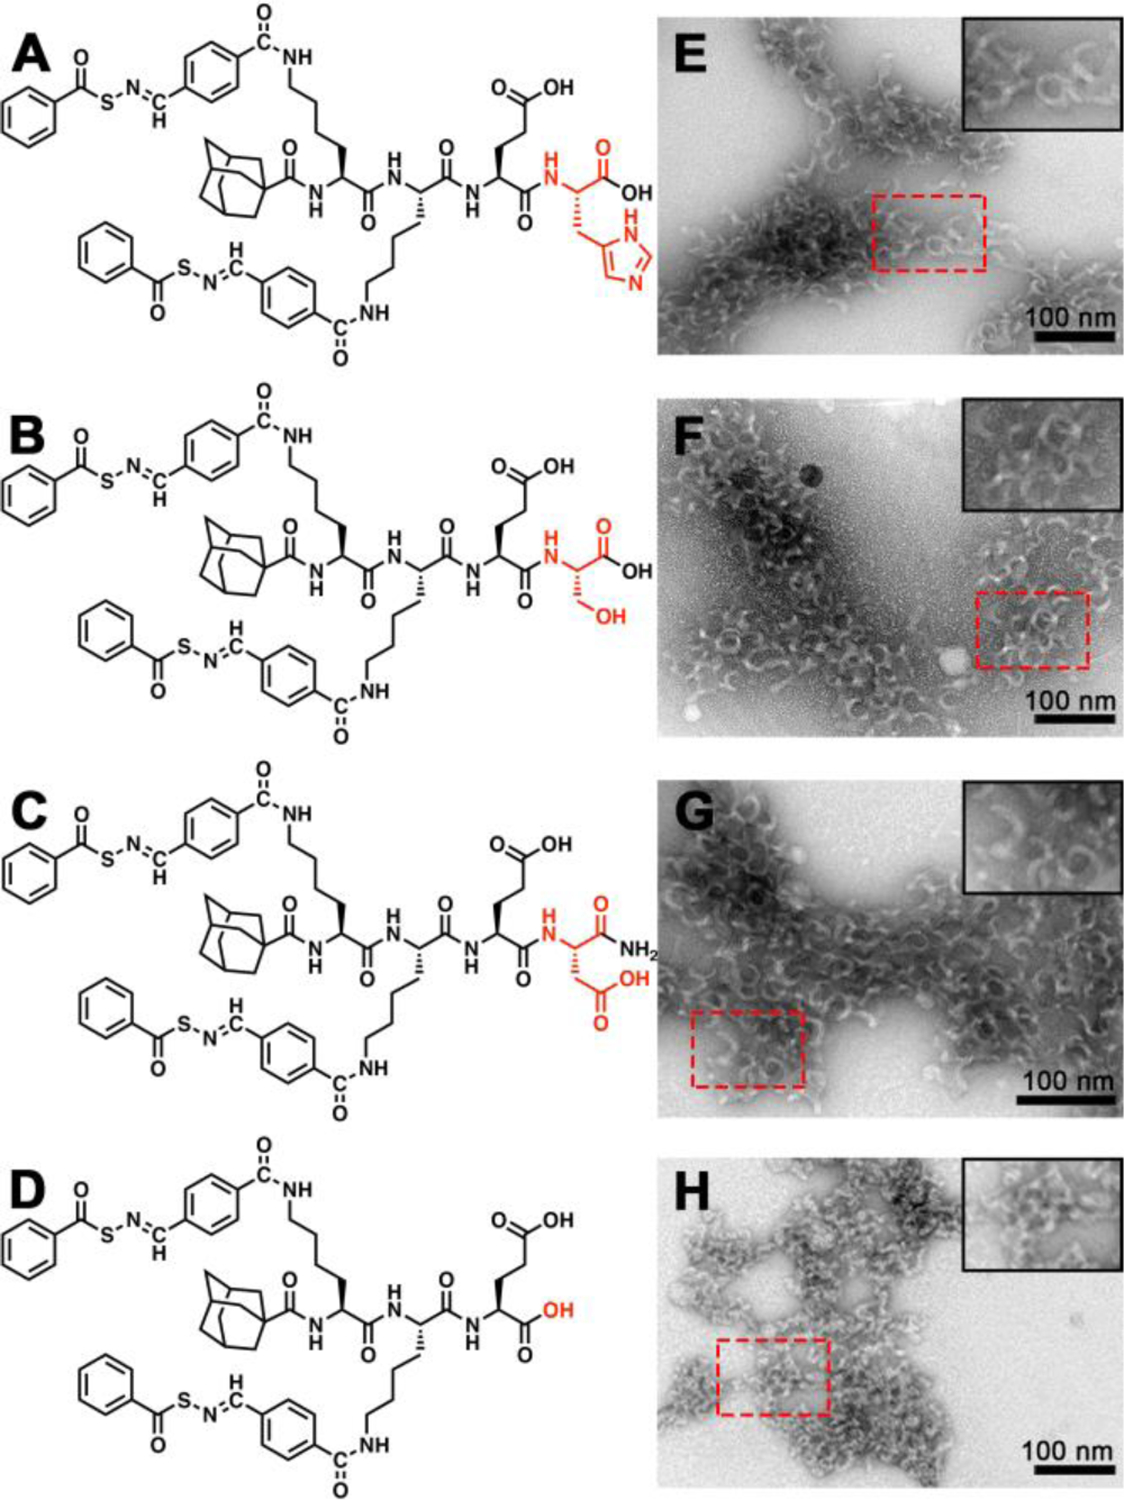
Figure 2.

Molecular structures and conventional TEM images of crescent nanostructures formed by (A, E) AdKSKSEH, (B, F) AdKSKSES, (C, G) AdKSKSED, and (D, H) AdKSKSE in PB (10 mM pH 7.4). Insets in the top right corners of panels E-H show zoomed-in images of the areas outlined by the dashed red rectangles. Solution concentration: 100 μM. All grids were stained by UA prior to imaging.
