
Figure 3.
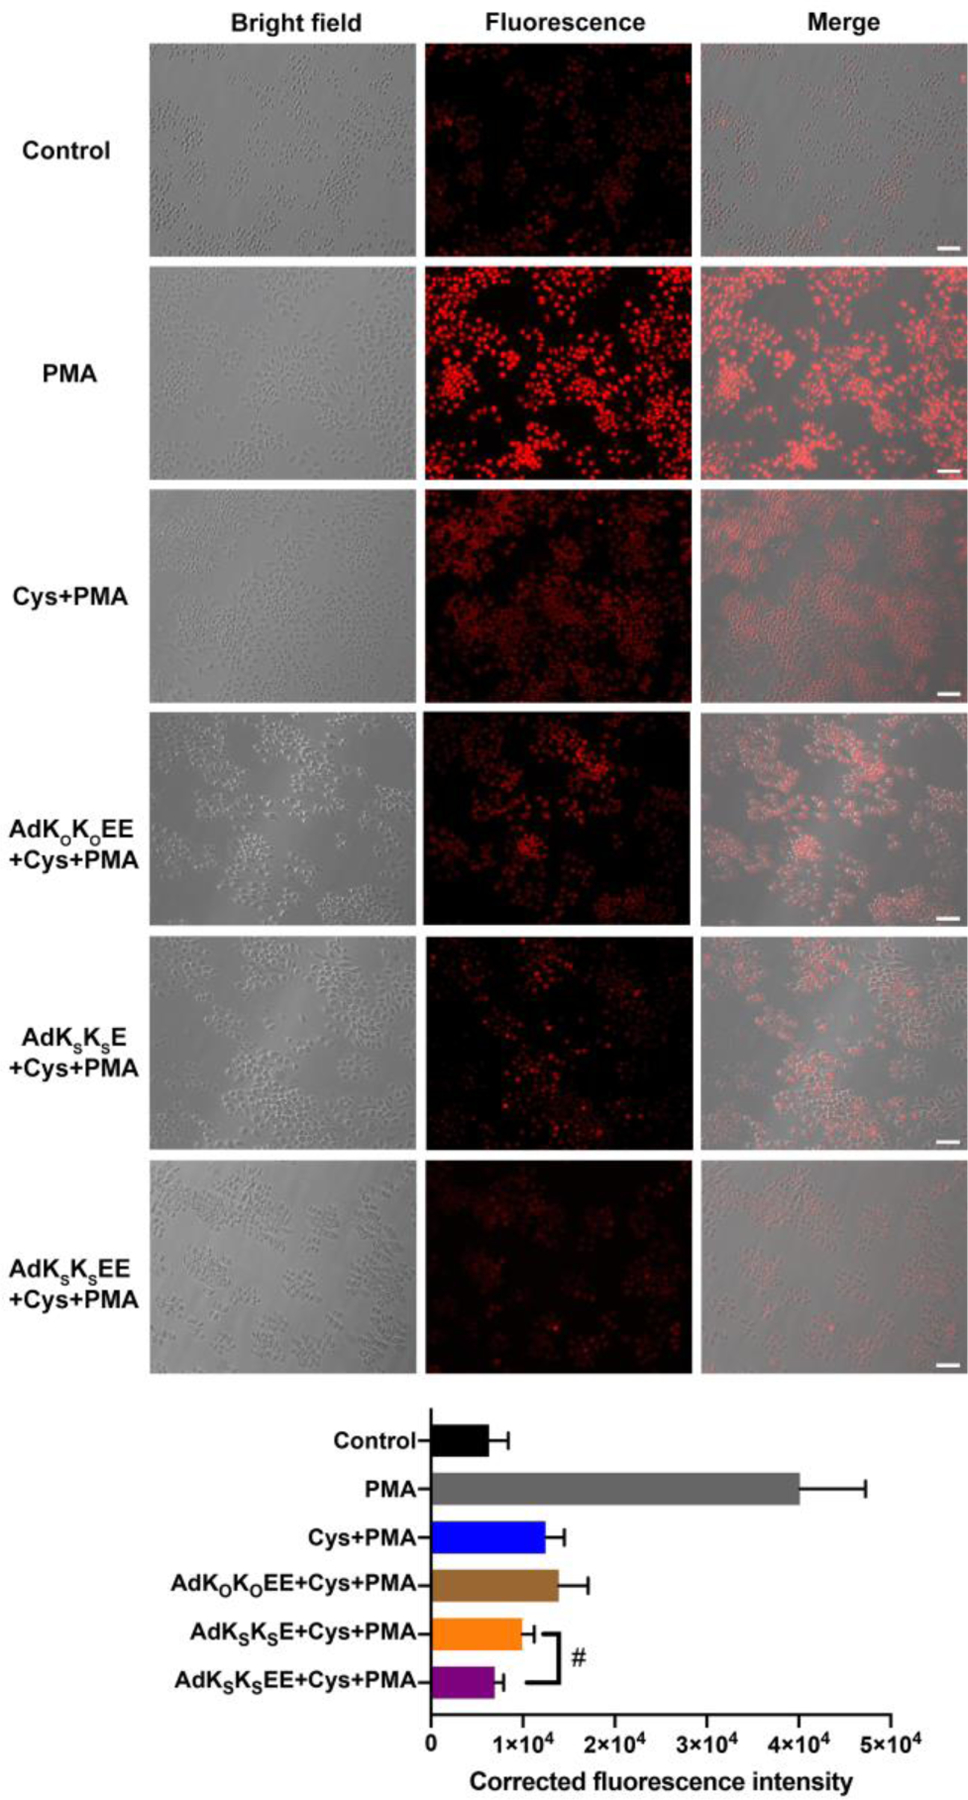
Bright field, fluorescence, and merged images showing fluorescence in RAW 264.7 macrophage cells pre-incubated with PBS only (row 2, grey bar), Cys (800 μM) (row 3, blue bar), AdKOKOEE (200 μM) + Cys (800 μM) (row 4, brown bar), AdKSKSE (200 μM) + Cys (800 μM) (row 5, orange bar), or AdKSKSEE (200 μM) + Cys (800 μM) (row 6, purple bar) for 30 min before exposure to PMA (1 μg/mL) (groups 2–6) or equal volume of DMSO for 3 h (row 1, black bar). After treatment, cells were incubated with ROS probe DHE (10 μM) for 30 min, washed, and imaged in DPBS by bright-field and fluorescence microscopy. Scale bars are 50 μm. Averaged fluorescence intensities of these six respective treatment groups were quantified by ImageJ (cell counts are > 30 for each group from three separate wells). # indicates p < 0.05 for a comparison of the groups indicated as determined by a one-way analysis of variance (ANOVA) with a Student–Newman–Keuls comparisons posthoc test.