
Figure 3. The inhibitory effect of ATP differs between the three PFK isoforms.
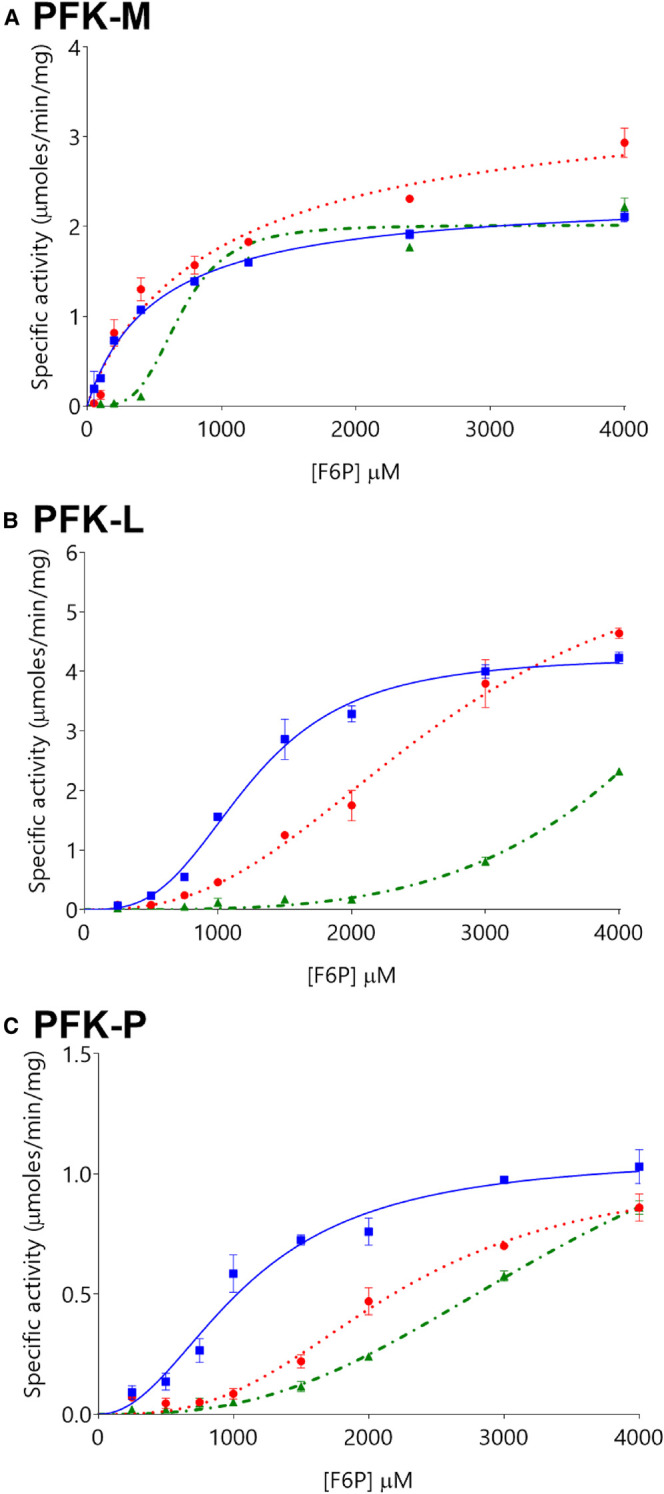
Levels of ATP inhibition differ between PFK-M (panel A), PFK-L (panel B), and PFK-P (panel C), at ATP concentrations of 0.5 mM (blue squares  with solid lines), 1 mM (red circles
  with dotted lines), and 2 mM (green triangles
  with dot-dash lines). (n = 3). Note that y-axis scales differ between Panels.