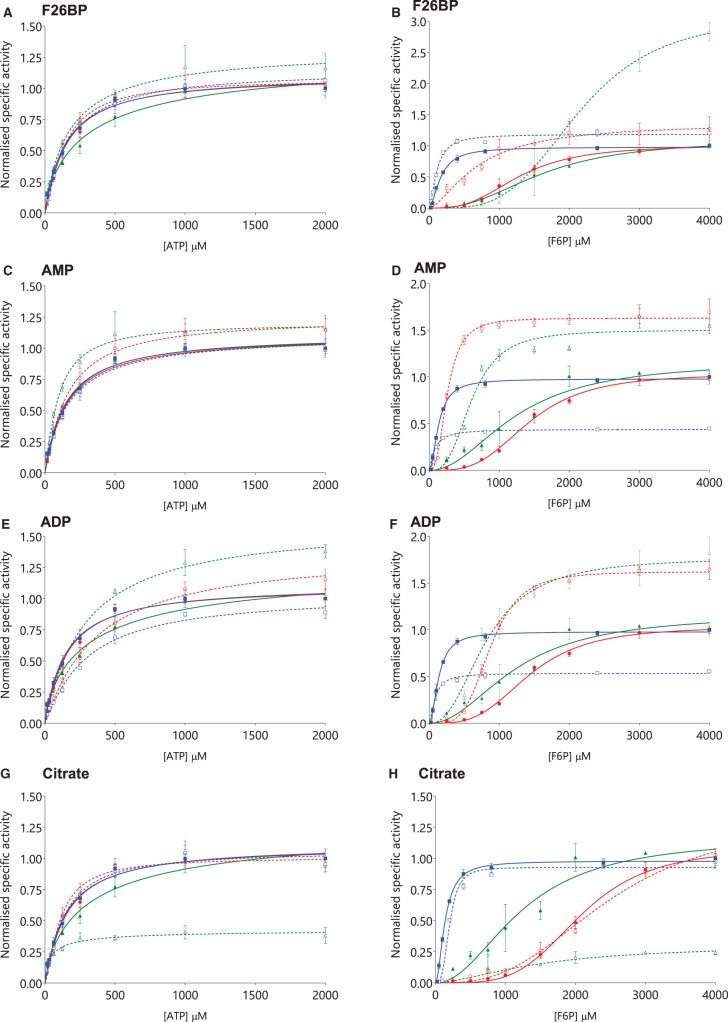
Figure 4. PFK-P activity is modulated more by allosteric regulators than PFK-M or PFK-L.
The effects of F26BP (10 µM) on ATP titrations (A) are less pronounced than on F6P titrations (B), as is found for AMP (1200 µM) on ATP (C) and F6P (D). ADP (600 µM) inhibits PFK-M and activates PFK-L and PFK-P for ATP titrations (E) and F6P titrations (F). Citrate (600 µM) inhibits PFK-P for ATP titrations (G) and F6P titrations (H). PFK-M (blue squares  with solid blue lines), PFK-L (red circles
  with solid red lines), PFK-P (green triangles
  with solid green lines). Curves obtained in the presence of allosteric modulators are given in equivalent dashed lines with open symbols. (n = 3, all values normalised to highest respective control value).

