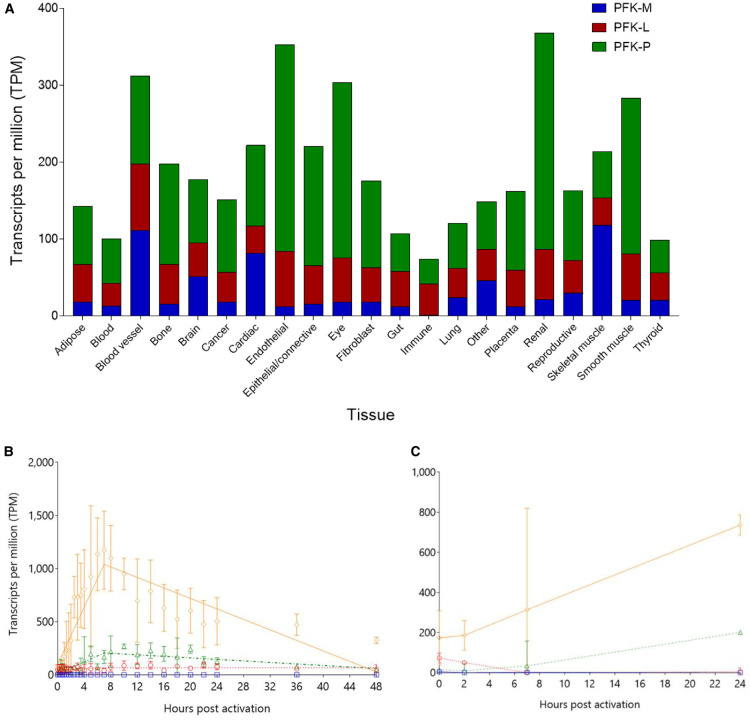
Figure 5. PFK isoforms show tissue specific dynamic differences in transcript levels.
(A) Mean average TPM values for each group of FANTOM-5 samples were compared for each isoform. Certain tissues contain more PFK transcripts than other tissues e.g. renal, endothelium, and eye. Proportions of each isoform follow the general hierarchy of PFK-P > PFK-L > PFK-M, though with notable exceptions e.g. immune cells and skeletal muscle. Liver data are included under ‘Gut’ heading, and shows: 47.2% PFK-L; 47.1% PFK-P; 5.6% PFK-M. (B,C) PFK-P transcription overtakes PFK-L in monocyte-derived macrophages exposed to LPS (Panel B) and Influenza A (Panel C), with PFKFB3 correlating with PFK-P. PFK-M (blue squares  with solid lines); PFK-L (red circles
  with dotted lines); PFK-P (green triangles
  with dashed lines); PFKFB3 (orange diamonds
  with dot-dashed lines). Lines are segmented lines of best fit, errors bars are standard deviations, n = 3 for LPS and n = 4 for influenza.

