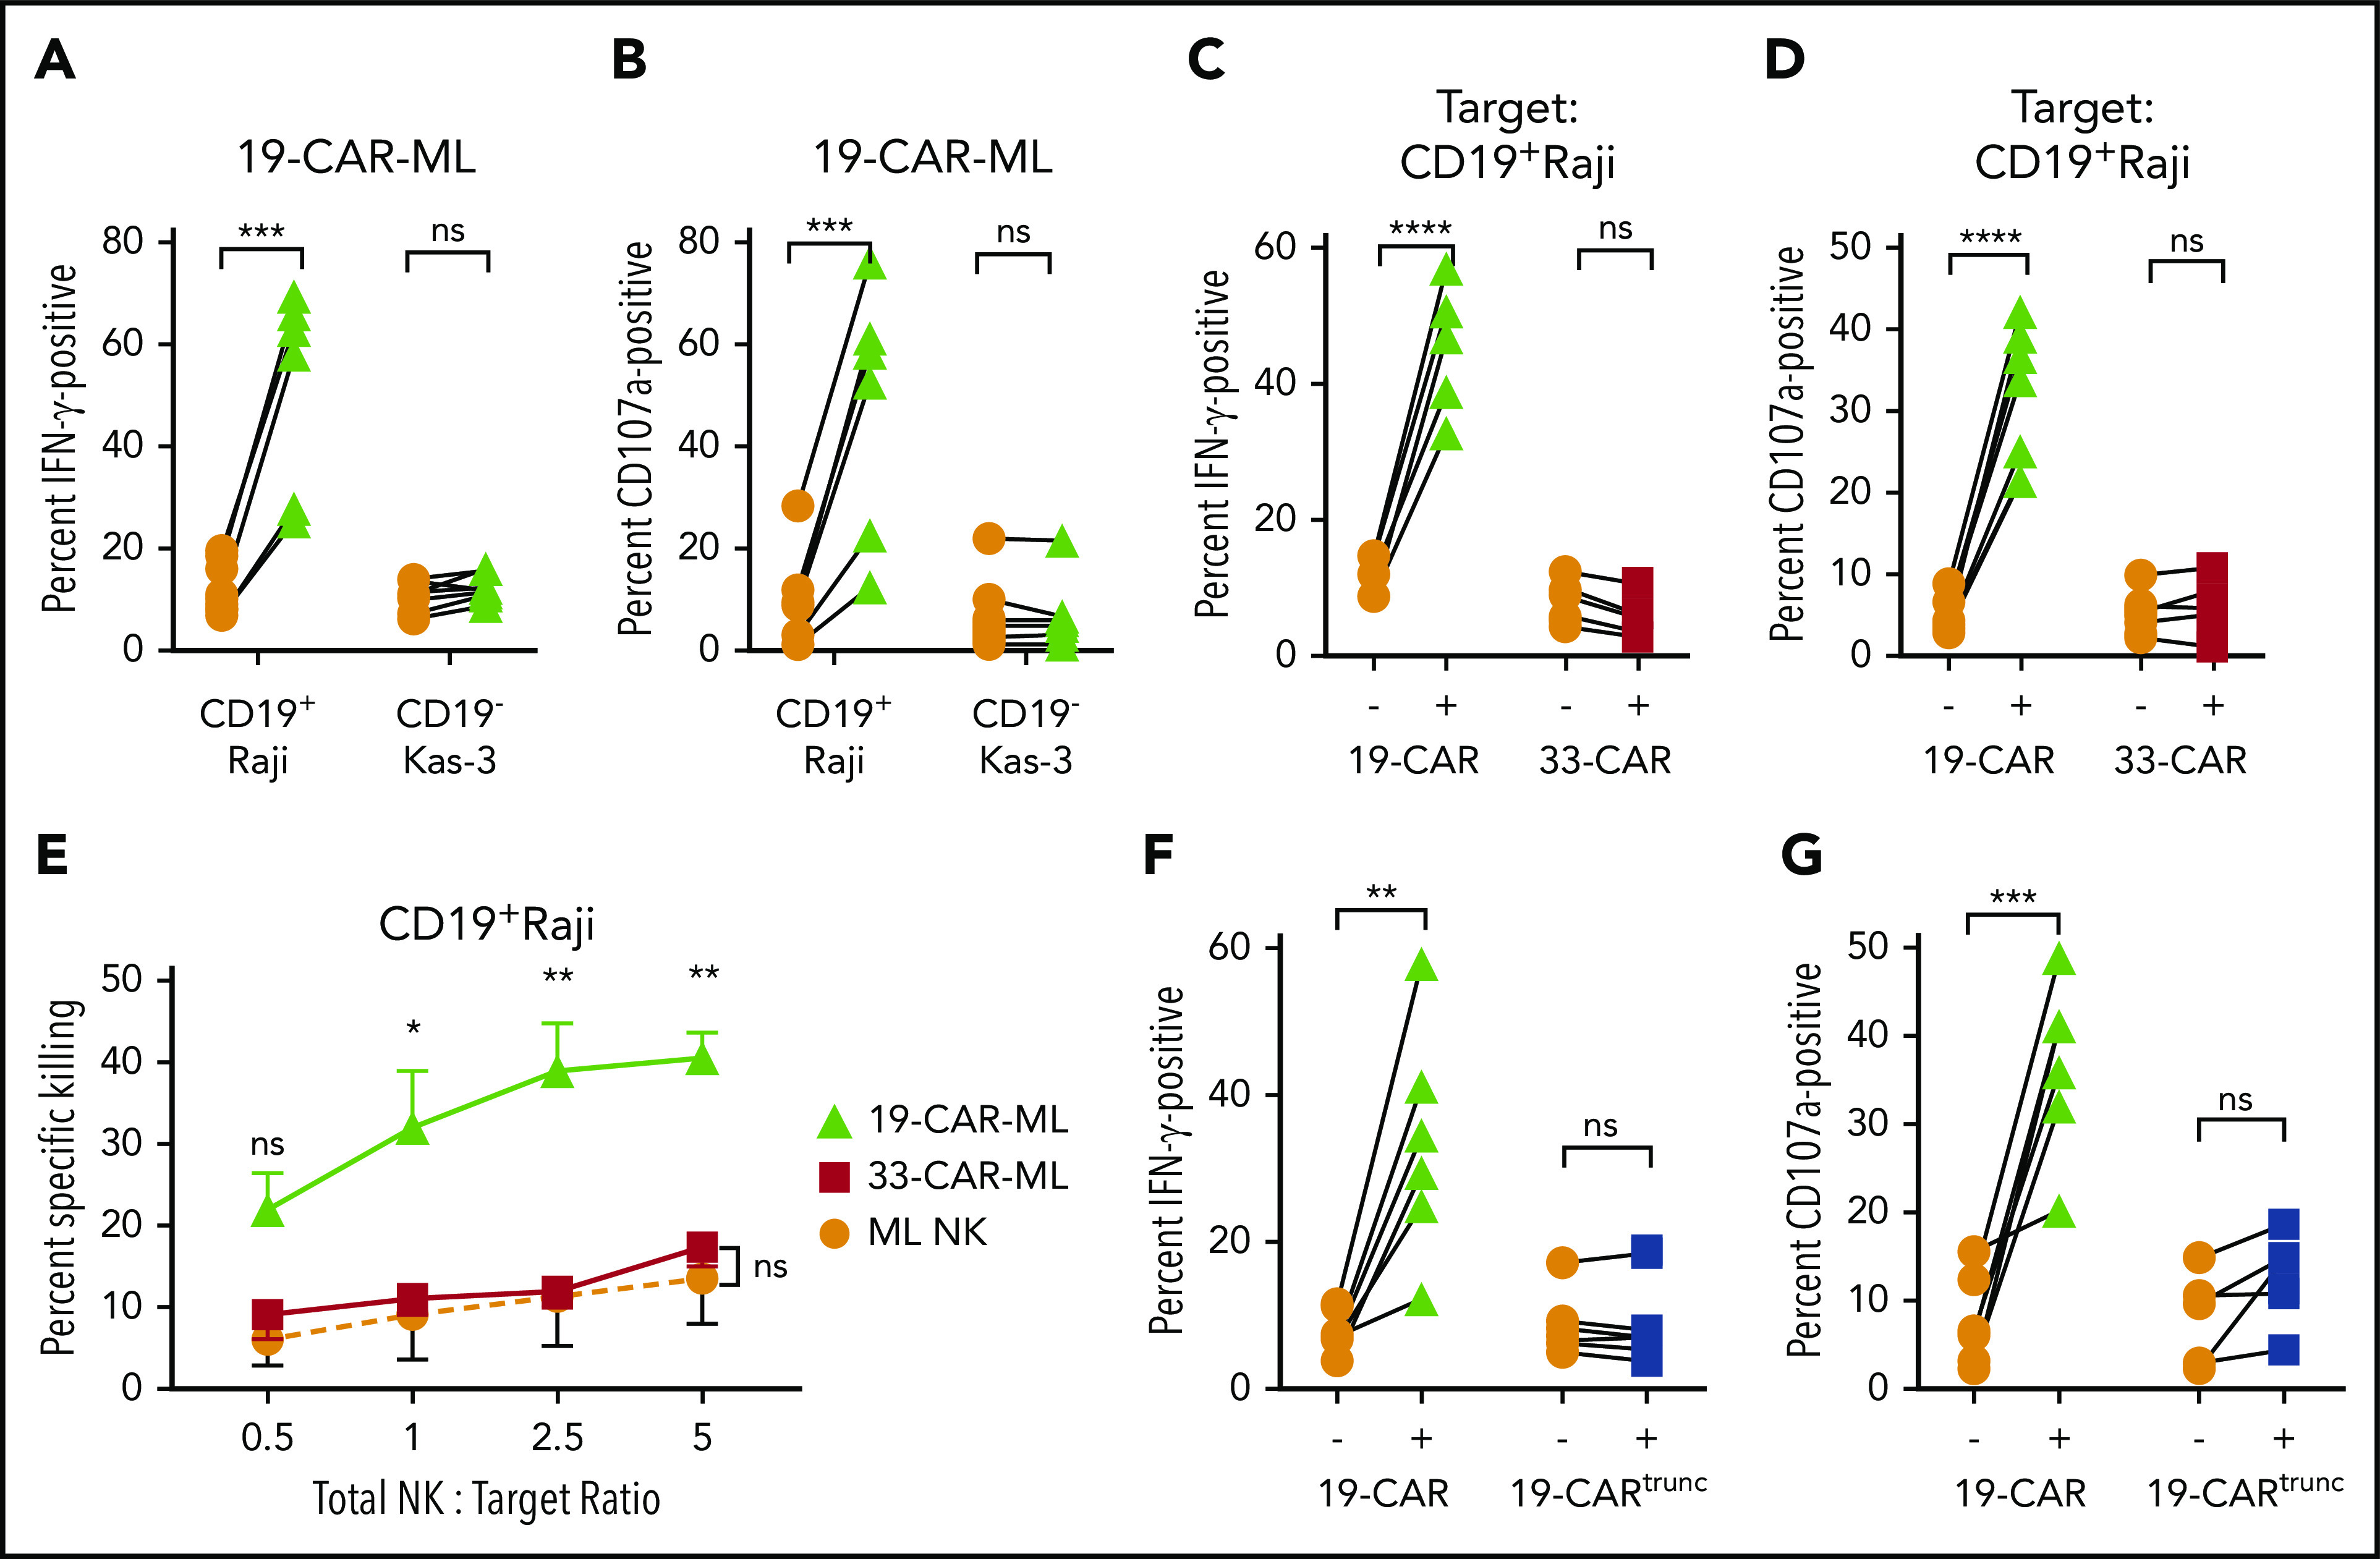
Figure 3.

19-CAR-ML NK cells display enhanced antigen (CD19)–specific responses against tumor cell lines. (A-B) 19-CAR-ML NK cells were incubated with CD19+ Raji or CD19− Kas-3 target cells for 6 hours at a 5:1 total NK/T ratio. Summary data show percentage of IFN-γ (A) and CD107a+ positive cells (B) (n = 7; 3 independent experiments). (C-D) ML NK, 19-CAR-ML NK, and 33-CAR-ML NK cells were incubated with Raji for 6 hours at a 5:1 total NK/T ratio. Summary data show IFN-γ production (C) and CD107a expression (D) (n = 5-6; 4 independent experiments). (E) 19-CAR-ML NK, 33-CAR-ML NK, and ML NK cells were assessed for cytotoxicity against Raji cells in a 4-hour flow-based killing assay. Summary data show mean ± SEM percentage of specific killing by 19-CAR-ML NK cells (green triangle), 33-CAR-ML NK cells (red square), and ML NK cells (orange circle; n = 4; 3 independent experiments). (F) 19-CARtrunc-ML NK cells were incubated with Raji for 6 hours at 5:1 total NK/T ratio. Summary data show percentage of (F) IFN-γ (F) and CD107a (G) (n = 5-6; 3 independent experiments). Data were compared using paired Student t test (A-D,F-G) or linear mixed model with Bonferroni’s multiple comparisons test (E). *P < .05, **P < .01, ***P < .001, ****P < .0001. ns, no significance.
