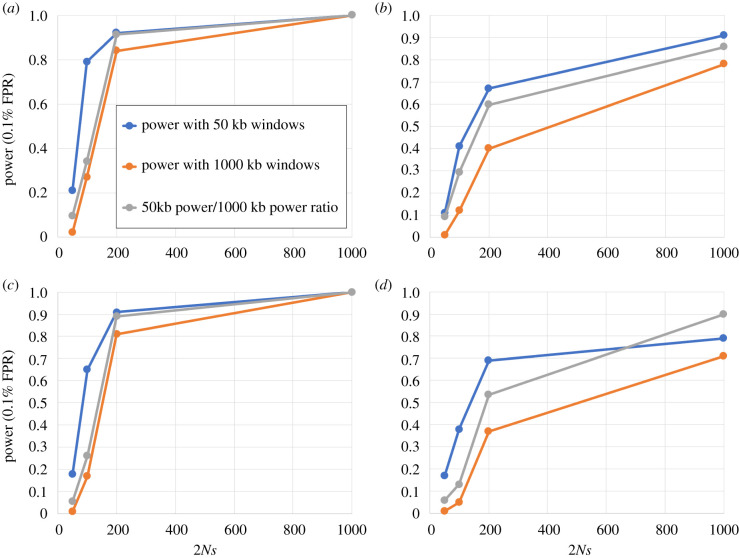
Figure 4.
Power of iHS windows to detect various sweeps. (a) Incomplete selective sweeps from a de novo mutation that reached a 50% frequency. (b) Sweep from a standing, 5% standing variant at the start of selection and that reached a 50% frequency. (c,d) same as (a,b), respectively, but for sweeps that reached a 70% instead of 50% frequency. The y-axis represents the statistical power (true positive rate) at 0.1% false positive rate (FPR). The x-axis represents the range of simulated selection intensities, ranging from 2Ns = 50 to 2Ns = 1000, where N = 10 000 in our simulations and s is the selection coefficient. Blue curve: power with 50 kb windows. Orange curve: power with 1000 kb windows. Grey curve: ratio of the power with 1000 kb windows over the power with 50 kb windows. (Online version in colour.)

