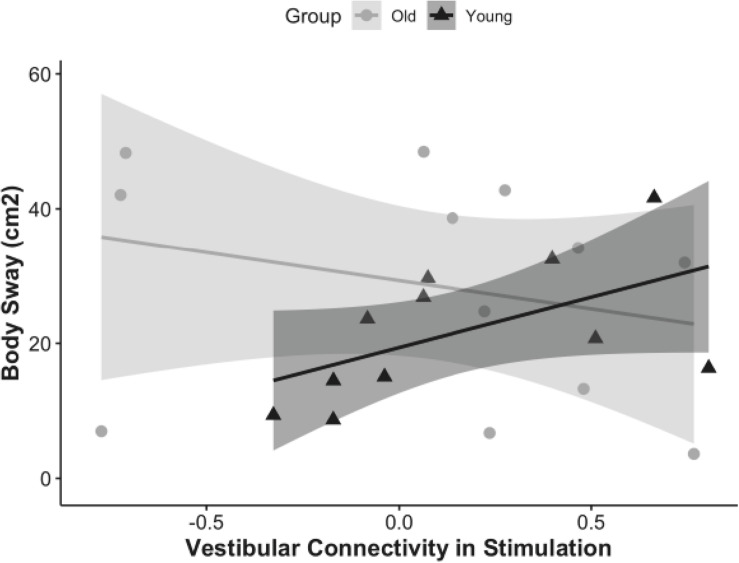
FIGURE 4.
Correlation of vestibular connectivity during stimulation with balance performance is shown for young and older adults as rho = 0.68, p = 0.02, CI (0, 0.84) and rho = –0.41, p = 0.1, CI (0, 0.49); respectively. The figure represents the subset of each group who completed the balance task, corrected for outliers.

