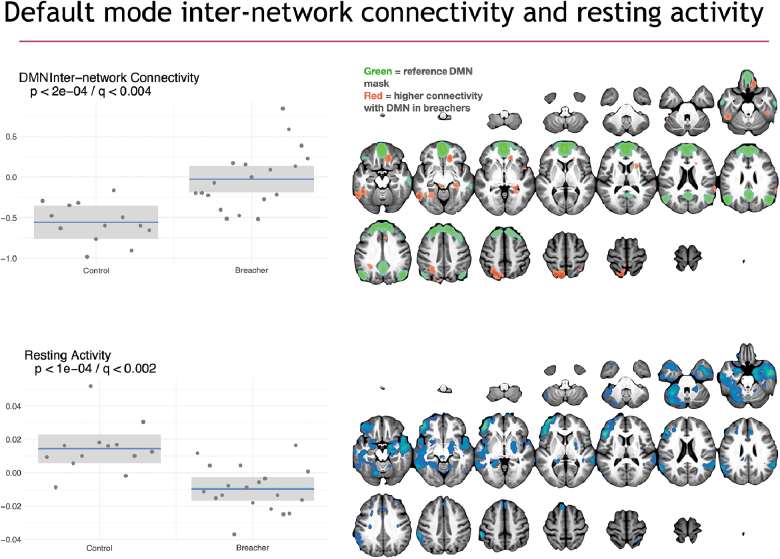
FIG. 6.
Functional connectivity group differences illustrated with DMN correlation maps and fALFF projections derived from resting-state fMRI. On the left are box plots showing the subject distribution based on the SiMLR-based imaging-specific decompositions. Along the x-axis are the controls and breacher groups with raw p values in the upper left of the plots. Connectivity between default mode network and other networks is increased in breachers whereas resting-state activity, largely within the default mode regions, is higher in controls. DMN, default mode network; fALFF, fractional amplitude of low-frequency fluctuations; fMRI, functional magnetic resonance imaging; SiMLR, similarity-driven multi-view linear reconstruction.

