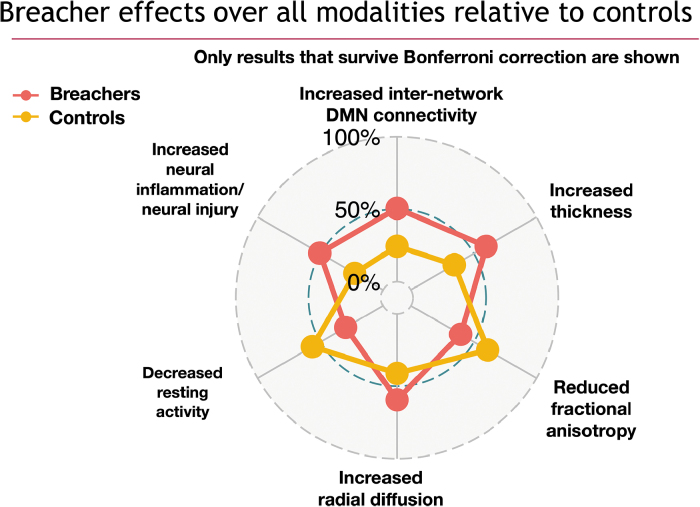
FIG. 7.
Summary statistical findings, in terms of mean modality-specific projection values, over all modalities used in the study, demonstrating statistically significant differences between breachers and controls. Eight modalities × two bases per modality resulted in 16 statistical tests. All axes of the spider plot represent significant effects where the limits of each axis represent the minimum and maximum of the modality-specific projections. Blood biomarker results, though important to this study, will be detailed in a separate publication where greater specificity about the role of each exosome measurement will be reported. DMN, default mode network.

