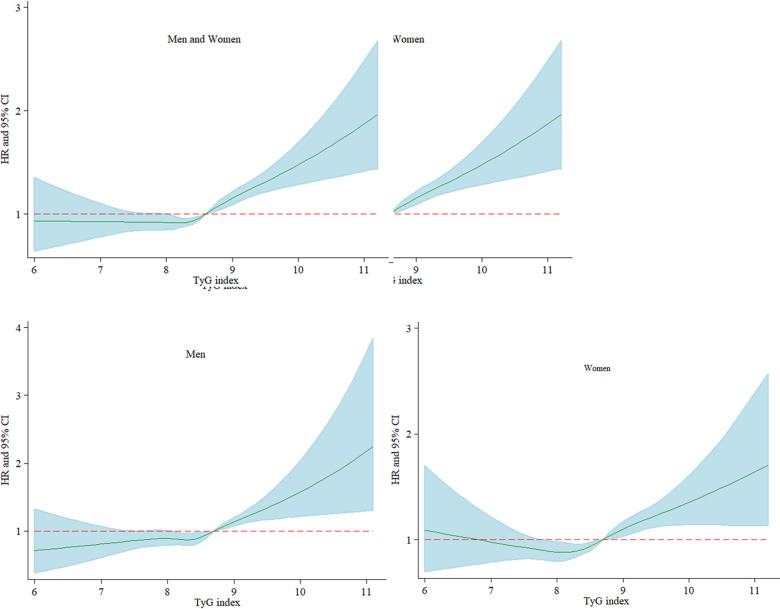
Figure 3.
Restricted cubic spline graph of risk of TyG index and the development of NAFLD. Multivariate adjusted HRs of NAFLD increased during follow-up when the baseline level of TyG index was 8.63 and above. Adjusted variables including age, sex (not for sex subgroup analysis), living alone, current smoking, exercise, waist-to-height ratio, systolic blood pressure, diastolic blood pressure, alanine aminotransferase, aspartate aminotransferase, total bilirubin and total cholesterol. TyG, triglyceride glucose; NAFLD, non-alcoholic fatty liver disease.

