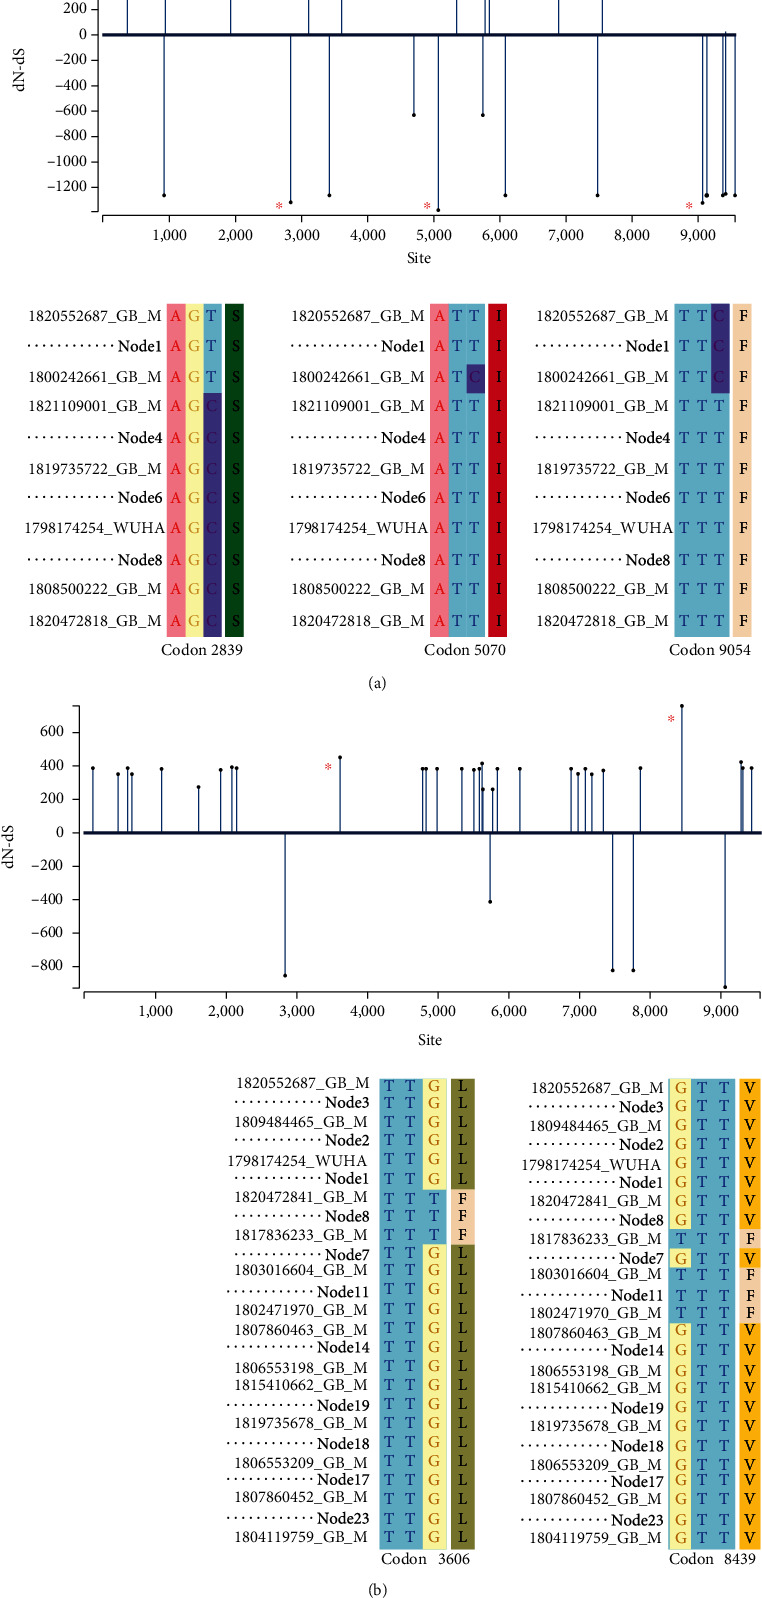
Figure 5.

(a) Selection site analysis of SARS-CoV2 genomes under the influence of purifying selection (upper panel) and corresponding alignment at the particular codon position under high purifying selection bias (indicated by ∗) is shown in the lower panel. (b) Selection site analysis of SARS-CoV2 genomes under the positive selection bias (upper panel) and the corresponding alignment at the particular codon position (indicated by ∗) under high positive selection bias is shown in the lower panel.
