Figure 3.

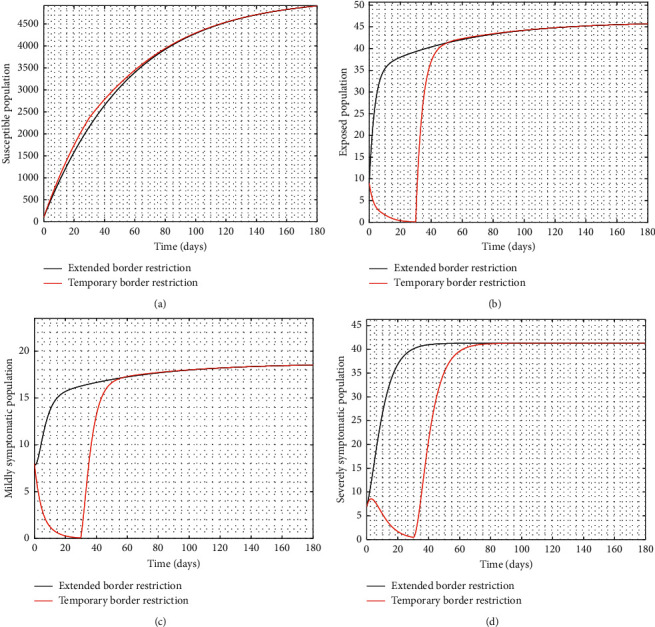
Time series of S, E, I1, and I2 at 100% implementation of controls with extended and temporary border closure (ℛ0=0.9586).

Time series of S, E, I1, and I2 at 100% implementation of controls with extended and temporary border closure (ℛ0=0.9586).