Fig. 1.
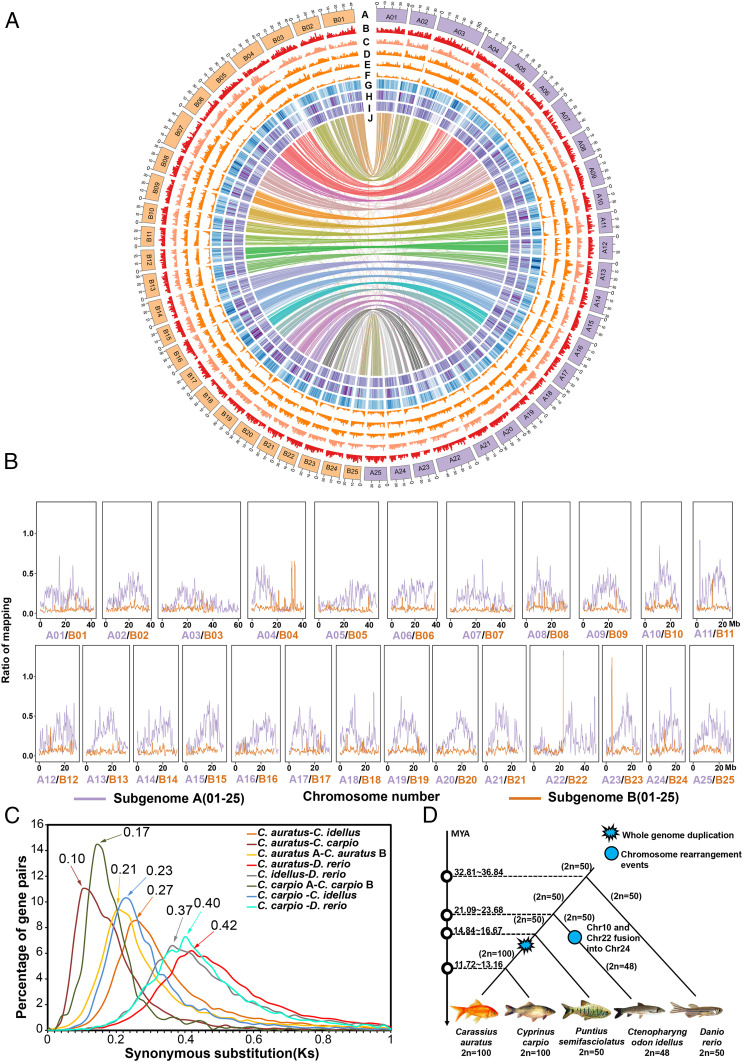
Goldfish genome features and their evolution. (A) The rings from outermost to innermost represent complete genomes in Mbp. Subgenome A is colored with purple, and subgenome B is colored with orange (ring A). Shown are gene density in goldfish (ring B), SNP density in the population of 201 goldfish (ring C), InDel density in the population of 201 goldfish (ring D), GC (guanine-cytosine) content of the whole goldfish genome (ring E), TEs in the whole goldfish genome (ring F), gene expression (ring G), chromosome collinearity between the subgenomes (ring H), gene expression (ring I), and chromosome collinearity between the subgenomes (ring J). Each signal was calculated in 500-kb sliding windows with 100-kb steps. (B) The proportion of P. semifasciolatus reads against mapped reads of goldfish. For patterns of the reads mapping for the other five Barbinae species, see SI Appendix, Figs. S9 and S10. (C) The distribution of nonsynonymous substitutions between selected pairs among taxa C. auratus (goldfish), C. carpio, C. idellus, D. rerio, illustrating the genetic distance between orthologous gene pairs (between two different taxa) or paralogous gene pairs (within the same taxon). (D) Genome duplications and chromosome rearrangements in C. auratus, C. carpio, C. idellus, P. semifasciolatus, and D. rerio.

