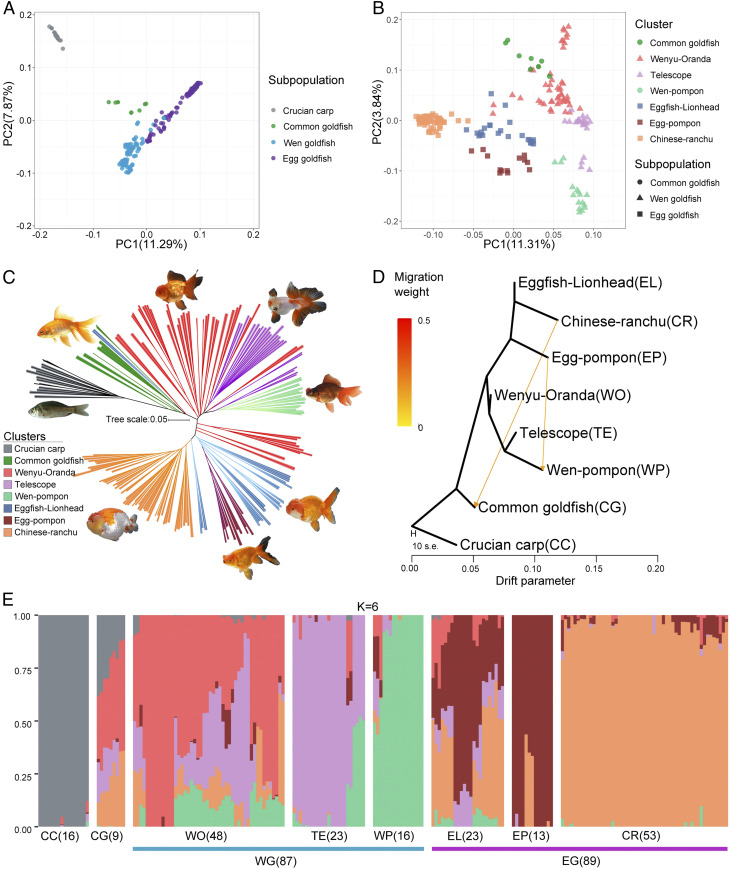
Fig. 2.
Population structure in goldfish. (A) Principal components of SNP variation. Samples from subpopulations of crucian carp (CC), common goldfish (CG), Wen goldfish (WG), and Egg goldfish (EG) and (B) Clusters of CG, Wenyu–Oranda (WO), Telescope eye (TE), Wen–Pompon (WP), Eggfish–Lionhead (EL), Egg–Pompon (EP), and Chinese–Ranchu (CR) are shown, with all of the samples in A, but excluding CC. The plots show the first two principal components. (C) Neighbor-joining clustering of CC, CG, WO, TE, WP, EL, EP, and CR based on genetic distance calculated from SNPs. Branch color indicates membership in one of the eight classified goldfish populations. The scale bar shows number of substitutions per site. (D) TreeMix analysis of 185 goldfish divided into seven clusters, with crucian carp samples serving as the outgroup. The arrows correspond to the direction of gene flow. (E) STRUCTURE plot for CC and goldfish. The distribution of the K = 6 genetic clusters is shown. The eight different populations and the sample number for each population are indicated after the abbreviated population names.

