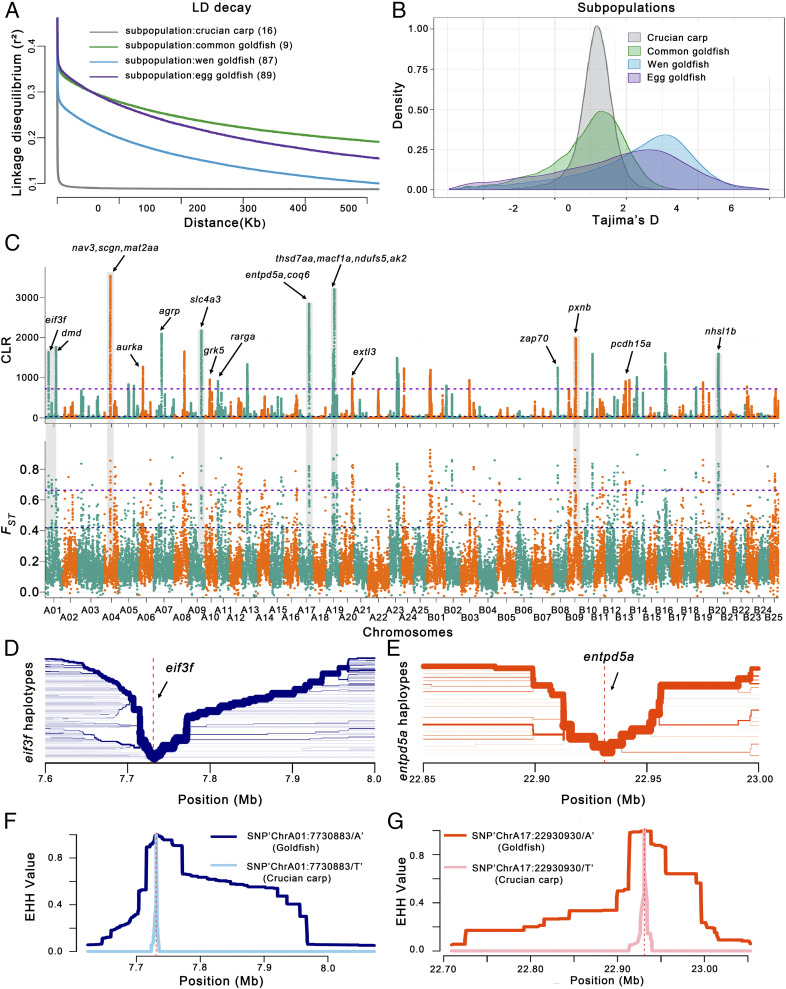
Fig. 3.
Genome-wide screening for domestication-associated selective sweeps in goldfish. (A) Decay of LD, (B) Tajima’s D value, and (C) whole-genome analysis of the domestication with selective sweeps inferred from the comparisons among common goldfish, Wen goldfish, Egg goldfish, and crucian carp. The genome-wide threshold of 2.5 was defined by the top 1% of Fst values. We calculated CLR scores to confirm selective sweeps based on domestication features; the highest CLR score was 5%. The arrows indicate the sweeps that occurred in goldfish during the domestication process, and the chromosome number of subgenome A and B is colored with purple and orange, respectively. Representative candidate genes in this region include: eif3f (Cau.A01G0002820), dmd (Cau.A01G0002960), nav3 (Cau.A04G0007000), scgn (Cau.A04G0010160), mat2aa (Cau.A04G0010480), aurka (Cau.A06G0010390), agrp (Cau.A07G0008060), slc4a3 (Cau.A09G0011550), grk5 (Cau.A10G0011480), rarga (Cau.A11G0000470), thsd7aa (Cau.A19G0007320), macf1a (Cau.A19G0007840), ndufs5 (Cau.A19G0007860), ak2 (Cau.A19G0007880), extl3 (Cau.A20G0012960), zap70 (Cau.B08G0005260), pxnb (Cau.B09G0001240), pcdh15a (Cau.B13G0010680), and nhsl1b (Cau.B20G0006630). (D and E) Haplotype bifurcation diagram in the goldfish population, with two illustrative examples shown with the extended haplotypes at the eif3f-allele of ChrA01 (D) and entpd5a-allele of ChrA17 (E). The haplotype bifurcation diagram visualizes the breakdown of LD at progressively longer distances from the core allele from the focal SNP, which is identified by a vertical dashed line. The thickness of the lines corresponds to the frequency of the haplotype. (F and G) EHH (extended haplotype homozygosity) for SNP “ChrA01:7730883/A/T” (diagnostic for eif3f) in the goldfish and crucian carp populations is shown with a dark and light blue line, respectively (F), and for SNP “ChrA17:22930930/A/T” (diagnostic for entpd5a) in the goldfish and crucian carp populations is marked with a deep and light red line, respectively (G).

