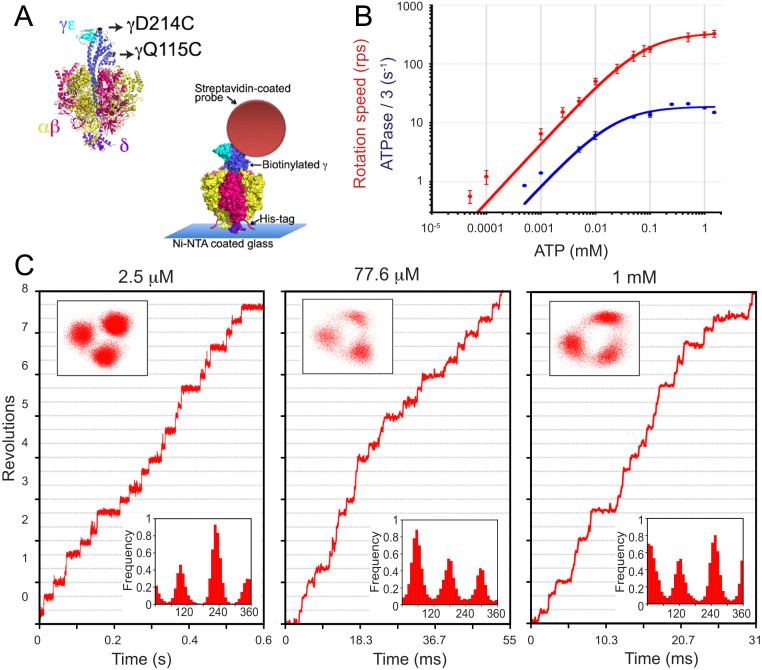
Fig. 2.
ATP-driven rotation of PdF1. (A) Single-molecule setup of PdF1. Two cysteine residues of the rotor γ-subunit (black arrows) were used to attach the rotary probe using biotin-streptavidin, and His tag in the β-subunit was used to immobilize PdF1 to the Ni-coated glass. (B) Time-averaged rotation speed of PdF1 (red) and one-third of the bulk-phase ATPase rate (blue) vs. Mg-ATP concentration. Solid lines show Michaelis–Menten fits. Vmax = 338 ± 6 rps and Km = 77.6 ± 5.3 µM for rotation and Vmax = 18.9 ± 1.2 s−1 and Km = 22.1 ± 8.2 µM for ATPase/3. Error bars represent SD. (C) Time courses of three different rotating particles observed under different [ATP] (indicated at the top of each graph). Upper Insets and Lower Insets display xy trajectories of the centroids and angular distributions, respectively. For each particle, the reference angle was arbitrarily assigned. In B, three repetitions were done for each measurement of ATPase. In B and C, 20 rotating molecules were analyzed per condition in the single-molecule analysis. Ni-NTA, nickel-nitrilotriacetic acid.

