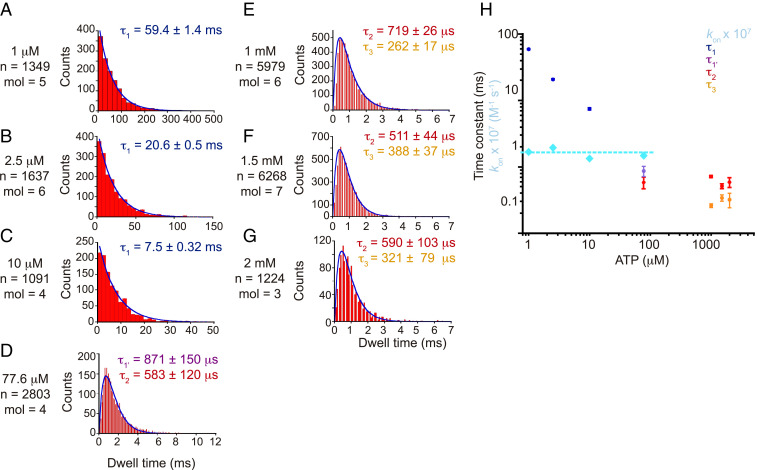
Fig. 3.
Dwell distributions for a composite of PdF1 molecules at different [ATP]. In each graph, τ denotes the time constant calculated from fitting (solid line) a single exponential decay function (A–C) or a double exponential decay function (D–G). At the left of each graph, [ATP], the total number of dwells summed (n), and the number of molecules collectively analyzed (mol) are displayed. (H) ATP concentration dependency of the time constants. The τ1-constants were used to calculate the second-order rate constant of ATP binding (kon), and the obtained values were plotted against ATP concentration in light blue squares. Error bars represent SE.

