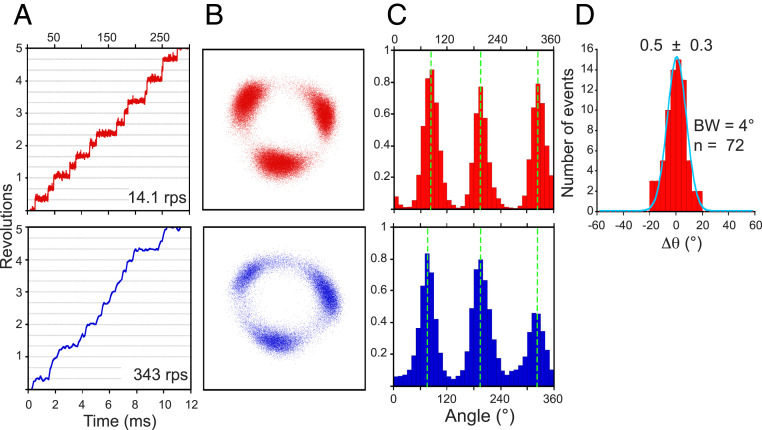
Fig. 4.
Observation of a single rotating PdF1 under low (red) and high (blue) [ATP]. One representative particle, from 24 molecules analyzed, is displayed. (A) Time courses of the rotation (rotation speed). (B) The xy position of the bead centroid. (C) Histograms of the angular position. The dashed lines highlight the mean value obtained from fitting a Gaussian distribution. (D) Distribution of the angular difference between the position of ATP cleavage relative to ATP binding (Δθ). The solid line represents the fit to a Gaussian model, and the value of the mean difference (± SE) is shown. For this experiment, 40-nm gold particles and a recording rate of 10,000 fps were used. BW, bin width; n, number of events analyzed.

