Fig. 6.
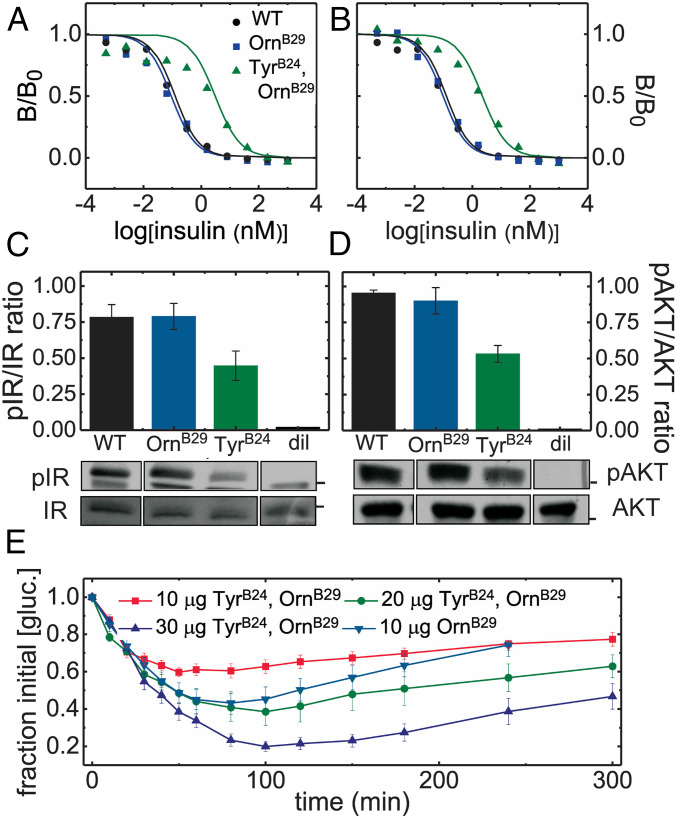
Biological activity of TyrB24, OrnB29-insulin in relation to control analogs. (A and B) Respective competitive receptor-binding assays IR-isoforms B and A (IR-B and IR-A). Data points are represented by colored symbols; corresponding lines indicate fitting; the color code is provided in A. Data in B is reprinted from ref. 35 with the permission of the authors and provided here for convenience. (C and D) Insulin signaling in a mammalian cell line: histogram depicting the (C) p-IR/IR ratio and (D) p-AKT/AKT ratio (determined by western blot) in MCF-7 cells treated with 50-nM insulin analogs or diluent vehicle (“dil”). Black bars indicate SEM. Bands corresponding to C p-IR and IR and D p-AKT and AKT are displayed underneath the corresponding columns of each histogram. Black boxes separating lanes indicate nonconsecutive lanes from the same gel. Black bars on IR/pIR and AKT/pAKT gels, respectively, indicate molecular mass of 100 kDa and 50 kDa. (E) A dose–response experiment assessing the in vivo activity of TyrB24, OrnB29-insulin in relation to control OrnB29-insulin in diabetic rats. Blood-glucose values averaged 400 mg/dL (n = 5).

