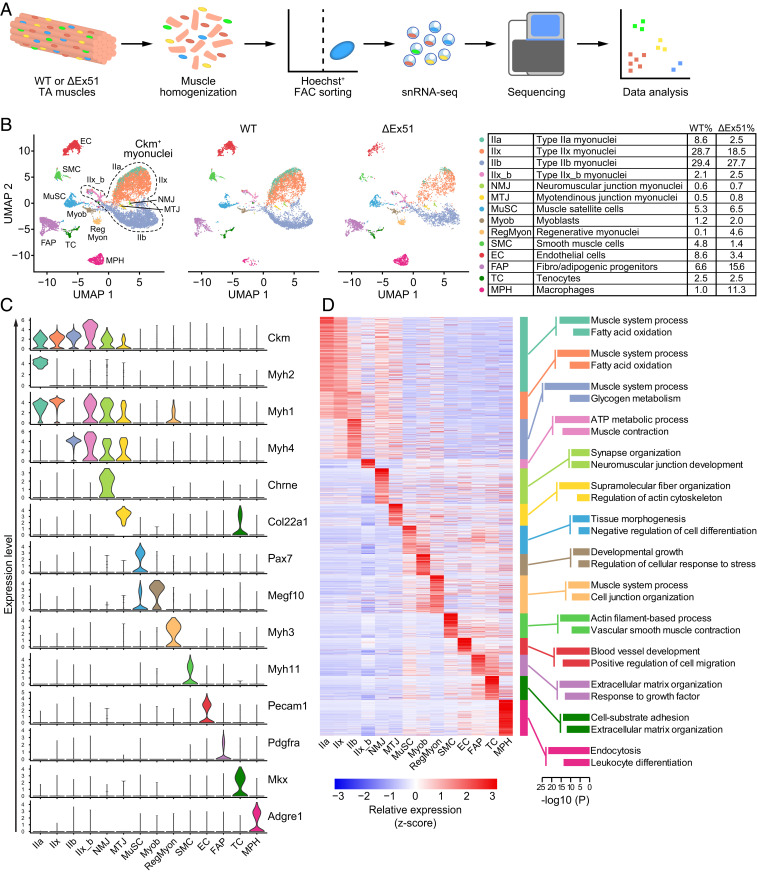
Fig. 2.
snRNA-seq of TA muscle from WT and ΔEx51 mice. (A) Schematic of the experimental design for snRNA-seq on skeletal muscle nuclei. (B) UMAP visualization of all of the nuclei (11,222 nuclei, Left) from WT and ΔEx51 TA muscle colored by cluster identity. UMAPs depicting nuclei of WT TA muscle (7,013 nuclei, Center) and nuclei of ΔEx51 TA muscle (4,209 nuclei, Right). Percentages of nuclei in each cluster are indicated in the table. (C) Violin plots showing the expression of selected marker genes for each cluster of nuclei. (D) Heat map showing z-score–transformed average expression of the marker genes for each cluster of nuclei (Left). Selected top enriched GO terms of the marker genes for each cluster of nuclei (Right).

