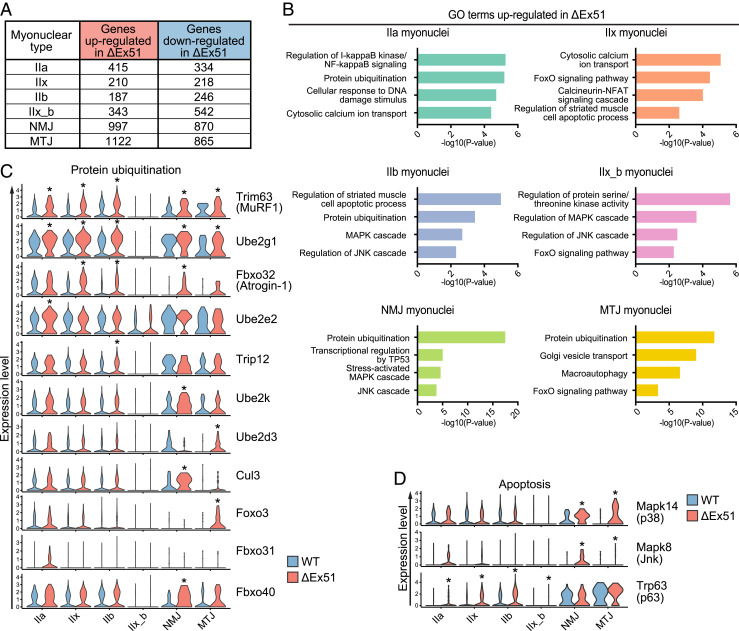
Fig. 3.
Analysis of gene expression changes in ΔEx51 myonuclei compared to WT myonuclei. (A) Number of up- and down-regulated genes in different clusters of ΔEx51 myonuclei. (B) Selected top GO terms enriched in up-regulated genes from the different clusters of ΔEx51 myonuclei. (C) Violin plots showing the differential expression of selected marker genes of protein ubiquitination between WT and ΔEx51 myonuclei. *Genes significantly differentially expressed. (D) Violin plots showing the differential expression of selected marker genes of apoptosis in WT and ΔEx51 myonuclei. *Genes significantly differentially expressed.

