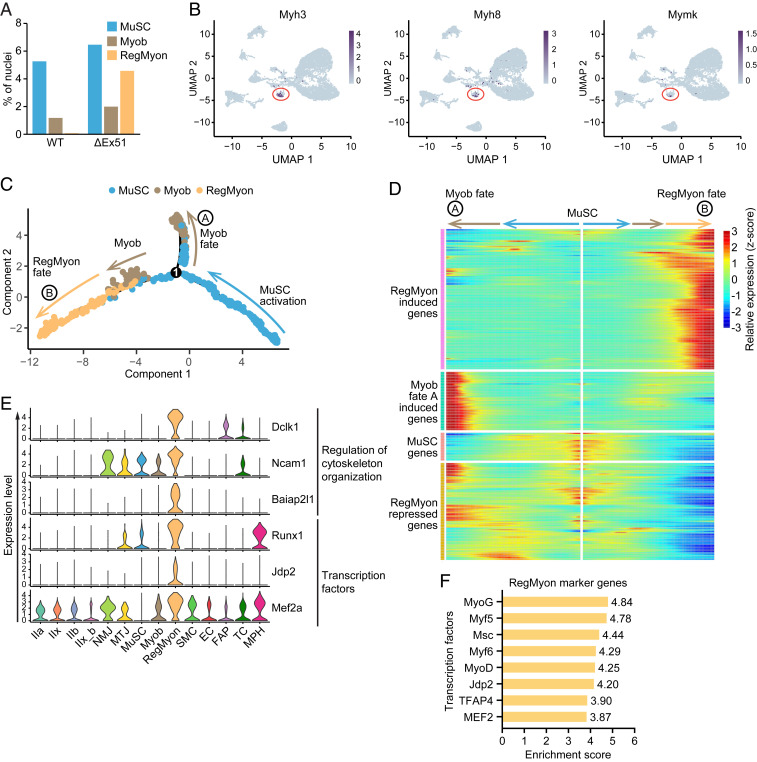
Fig. 4.
Analysis of gene expression dynamics in WT and ΔEx51 myonuclei. (A) Percentage of nuclei of clusters involved in the regeneration of skeletal muscle (Clusters MuSC, Myob, and RegMyon) in WT and ΔEx51 TA muscles. (B) UMAPs depicting the expression of Myh3, Myh8, and Mymk in the RegMyon cluster. (C) Pseudotime ordering of all of the nuclei of Clusters MuSC, Myob, and RegMyon. Each dot represents one nucleus (color-coded by its identity) and each branch represents one cell state. Activation of the MuSC cluster can lead to Myob fate A or to RegMyon fate B. (D) Heatmap showing z-score–transformed average expression of the differentially expressed gene dynamics toward Myob fate A and RegMyon fate B along pseudotime. The differentially expressed genes were clustered into four gene sets according to k-means. (E) Violin plots showing the expression of selected genes (involved in the regulation of cytoskeleton organization or encoding transcriptional factors) highly expressed in the nuclei of Cluster RegMyon. (F) Enrichment score of the top transcription factor binding motifs identified by iRegulon from the promoter regions of the marker genes of the Cluster RegMyon.

