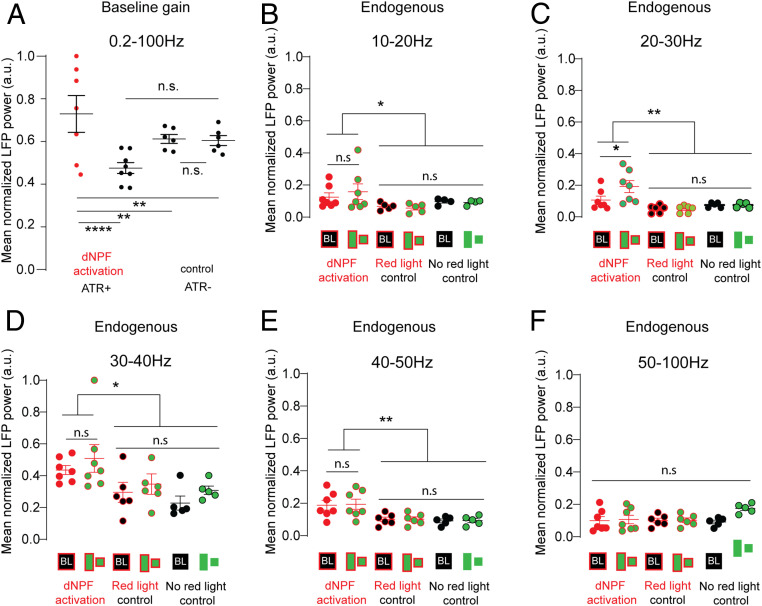
Fig. 5.
(A) Mean normalized baseline gain (no visual stimulation, 0.2 to 100 Hz) for control (ATR−; red light [black], n = 6) and during dNPF circuit activation (ATR+; red light [red], n = 7; Wilcoxon rank sum test, error bars = 95% CIs of the mean). (B–F) Mean normalized LFP power (normalized to maximum value) of filtered endogenous frequency bands compared between two controls (ATR−, no red light, n = 5 and ATR−, red light, n = 6) and dNPF circuit activation (ATR+, red light, n = 7). Data show means across all trials per fly, ± SEM. ANOVAs: 10 to 20 Hz: P = 0.048, F(DFn,DFd) = 1.89 (7, 42); 20 to 30 Hz: P = 0.003, F(DFn,DFd) = 1.751 (7, 42); 30 to 40 Hz: P = 0.0106, F(DFn,DFd) = 0.4802 (7, 42); 40 to 50 Hz: P = 0.0056, F(DFn,DFd) = 1.086 (7, 42); 50 to 100 Hz: not significant (n.s.) P = 0.99, F(DFn,DFd) = 0.878 (7, 42). Tukey’s multiple comparison test. All animals are dNPF-Gal4; UAS-CSChrimson(x)::mVenus flies that were either fed all trans-Retinal (ATR+) or not (ATR−). BL, baseline. *P < 0.05; **P < 0.01; ****P < 0.0001.

