Fig. 6.
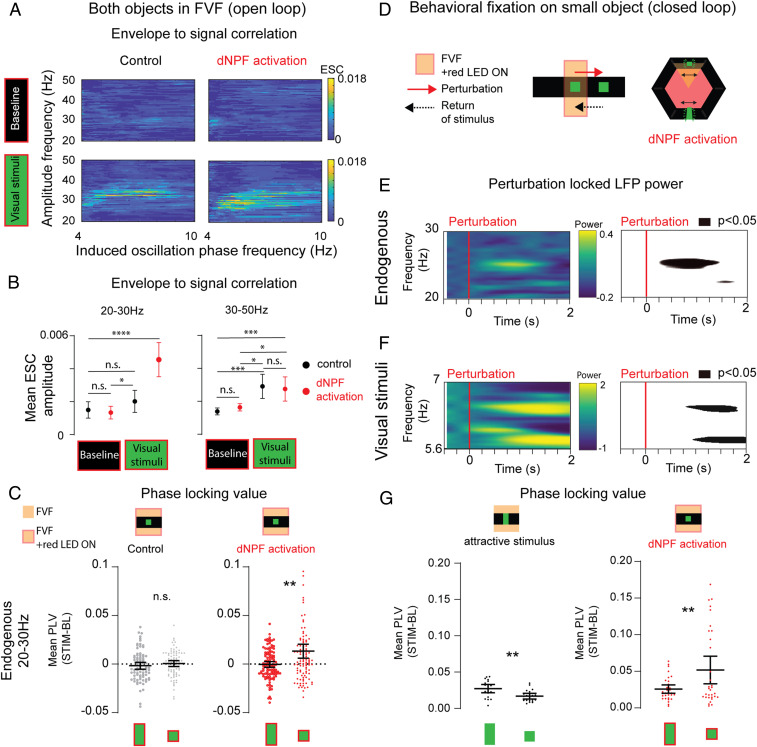
Endogenous 20- to 30-Hz oscillations are phase locked to selected visual objects. (A) Comodulation maps of ESCs during open-loop experiments. The panels show significant positive correlations between endogenous amplitude frequencies (20 to 50 Hz) and the phase of induced frequencies (4 to 10 Hz are shown) for baseline and visual stimulation conditions. Control: ATR−, red LED light, n = 6. dNPF activation: ATR+, red LED light, n = 7 (Pearson’s correlation). (B) Mean ESC amplitude between 20 to 30 Hz (Left), 30 to 50 Hz (Right), and phase of frequency tags (4 to 10 Hz) during baseline and visual stimulation conditions. Control: ATR−, red LED light, black, n = 6. dNPF activation: ATR+, red LED light, red, n = 7. Repeated measures one-way ANOVA: 20 to 30 Hz: P < 0.0001, degrees of freedom = 3, F(1.863, 190.1) = 15.98; 30 to 50 Hz: P < 0.0001, degrees of freedom = 3, F(2.413, 251.0) = 11.39; both: comparisons for differences between individual groups were analyzed using the false discovery method of Benjamini and Hochberg. (C) Mean PLVs of evoked frequencies of visual objects with endogenous 20- to 30-Hz activity. Baseline PLV values were subtracted from values during visual stimulation. Control (Left): ATR−, red light, black, n = 6, trials = 80 (P = 0.3307, effect size =0.15). dNPF activation: ATR+, red light, red, n = 7, trials = 109 (P = 0.009, effect size =0.51; paired t test [two tailed], bootstrapped data showing means with 95% CIs). (D) Behavioral fixation on small bar after perturbation in closed loop, causing dNPF activation. (E, Left) Spectrogram showing mean LFP power over time for endogenous 20- to 30-Hz activity, following a perturbation. (E, Right) Map showing P values significantly different (P < 0.05) from preperturbation baseline (ATR+, red light, n = 9, z-scored data). (F, Left) Spectrogram showing mean LFP power over time for evoked frequencies during visual stimulation. (F, Right) Map showing P values significantly different (P < 0.05) from preperturbation baseline (ATR+, red light, n = 9). (G) Mean PLV of evoked frequencies of visual objects and endogenous 20 to 30 Hz. Baseline PLV values were subtracted from values during visual stimulation. Control (Left): ATR+, no red light; flies return the large visual object to the FVF. n = 9, perturbation events = 19 (P = 0.004, effect size =1.03), successful perturbations. dNPF activation (Right): ATR−, red light, flies return the small visual object to the FVF, n = 7, perturbation events = 32 (P = 0.009, effect size =0.7667), successful perturbations (paired t test [two tailed], bootstrapped data showing means with 95% CIs, data were tested for skewness: 0.95 and showed a log-normal distribution [Shapiro–Wilk test, P = 0.06, α = 0.05, resampling data with 1,000 permutations showed no bimodal distribution]). n = 9. All animals are dNPF-Gal4; UAS-CSChrimson(x)::mVenus flies that were either fed all trans-Retinal (ATR+) or not (ATR−). BL, baseline; n.s., not significant; Stim, stimulus. *P < 0.05; **P < 0.01; ***P < 0.001; ****P < 0.0001.

