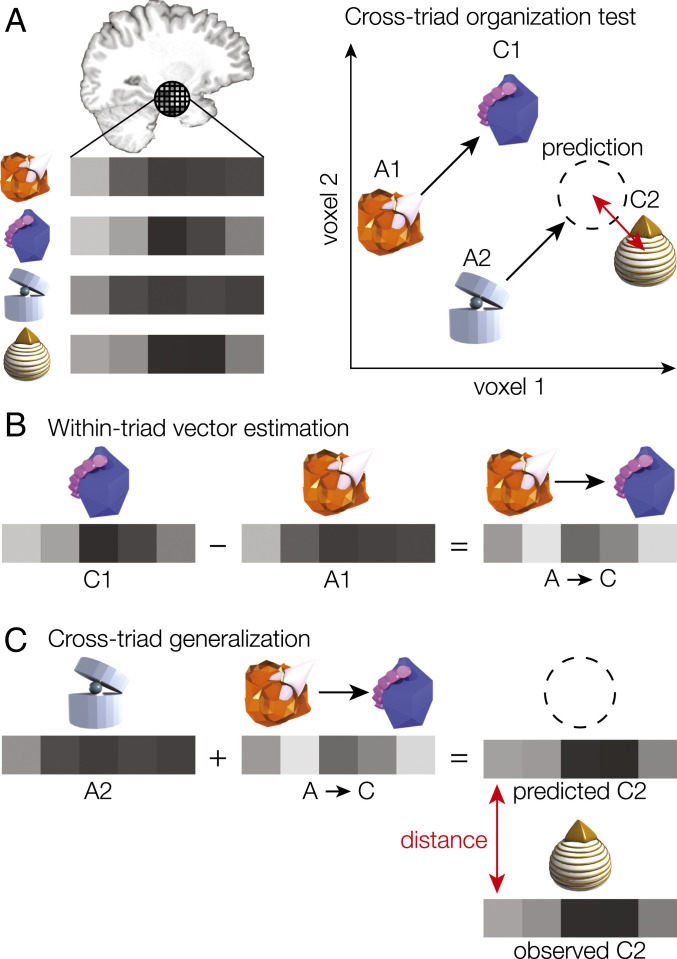
Fig. 2.
(A) For a given brain region, we measured activation estimates for each voxel to obtain an activation vector for each item. We tested for a common neural geometry across triads by using the patterns from one triad to predict the pattern associated with a different triad (dotted circle). If the triads share consistent representational vectors between the elements, then the difference between the predicted and observed patterns for the left-out item (red arrow) should be small. (B) We first estimated the average vector from A to C by subtracting the A pattern from the C pattern for all triads in a training set and averaging the difference vectors. (C) We then added the estimated A→C vector to the A item of a left-out triad, forming a prediction of what the pattern of activation should be for the corresponding C item. Finally, we evaluated the prediction by calculating the Euclidean distance between the prediction and the activation pattern observed for that item. We compared distance error to a chance distribution estimated by randomly swapping A and C items within each triad.

