Fig. 7.
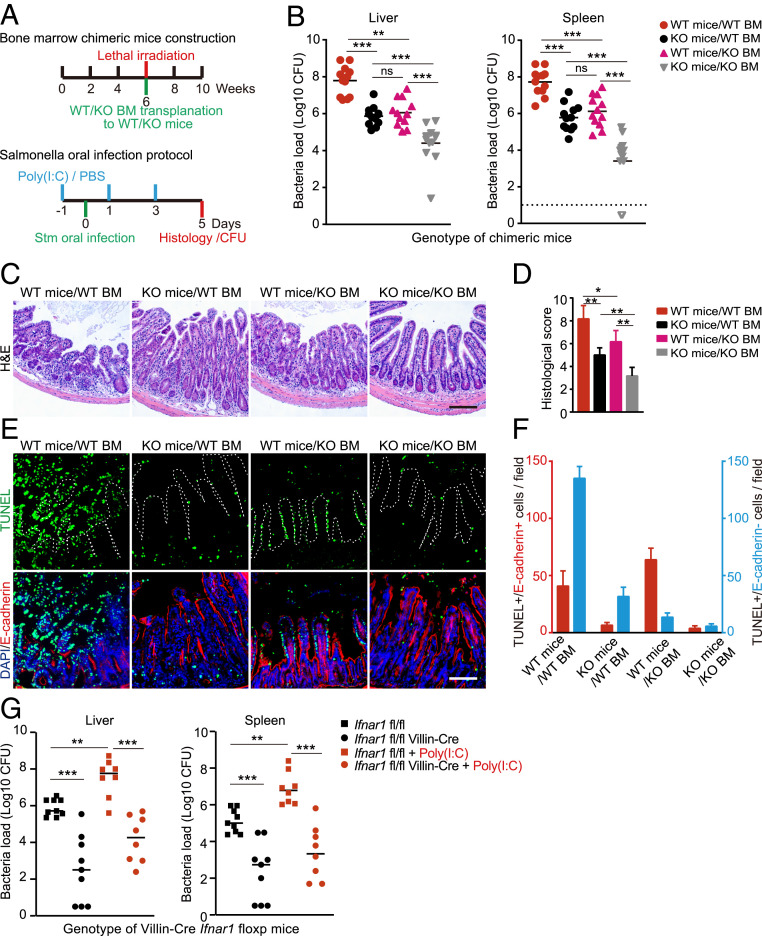
IFN-I signaling in intestinal epithelial cells promotes Stm pathogenesis. (A) Experimental timeline for generation of Ifnar1 chimeras (Top) and oral Stm infection protocols for poly(I:C)-primed chimeras or primed/unprimed Villin-Cre transgenic mice (Bottom). (B) Liver and spleen Stm CFU burdens from chimeric mice 5-d post-Stm infection. n = 12 mice per group. (C) Representative hematoxylin/eosin-stained ileal sections from chimeric mice 5-d post-Stm infection. (Scale bars, 100 μm.) (D) Average histological scores of chimeric mice 5-d post-Stm infection from eight fields per group (n = 2 to 3 mice per group). (E) Representative images of ileal sections from chimeric mice 5-d post-Stm infection. IECs were identified with E-cadherin (red), dying cells with TUNEL (green), and nuclei with DAPI (blue). The white dashed line marks the epithelial surface. (Scale bar, 100 μm.) (F) Quantification of TUNEL+/E-cadherin–positive (red) or TUNEL+/E-cadherin–negative (blue) cells per field from eight fields per group (n = 2 to 3 mice per group). (G) Liver and spleen Stm CFU burdens from Villin-Cre/Ifnar1fl/fl mice 5-d post-Stm infection. n = 9 mice in each PBS treatment group and n = 8 in each poly(I:C) treatment group. Statistical analysis was performed by two-tailed Student’s t test in D. Statistical analysis was performed by two-tailed Mann–Whitney U test in B and G. Data shown are means ± SD from the indicated sample sizes. (*P < 0.05, **P < 0.01, and ***P < 0.001). See also SI Appendix, Fig. S6.

