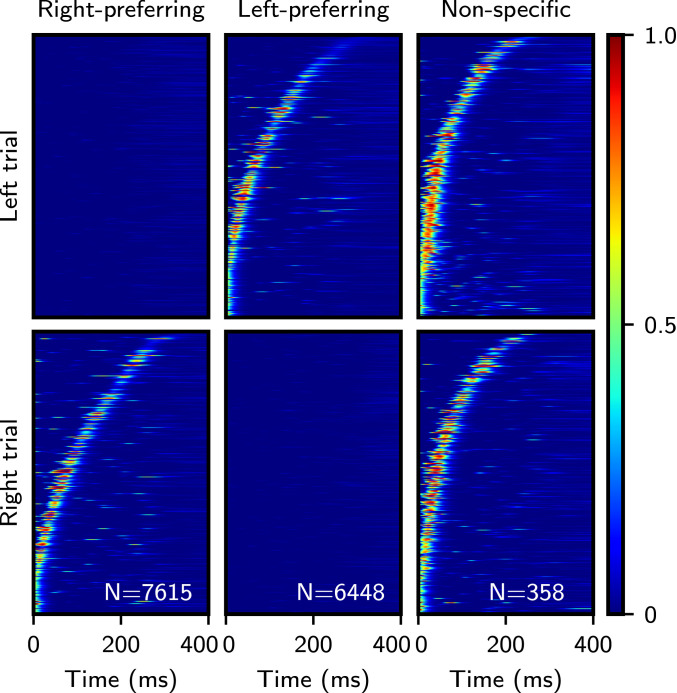
Fig. 5.
Diverse selectivity properties emerge after learning two random input sequences. Single-trial raster plots display units that are active only during the right trial (Left), left trial (Center), and at similar times during both trials (Right). Activity is sorted by the time of maximal activity, and this sorting is fixed across rows. Numbers indicate amount of neurons passing selection criteria (total neuron count is 40,000). , and all other parameters are as in Fig. 4.

