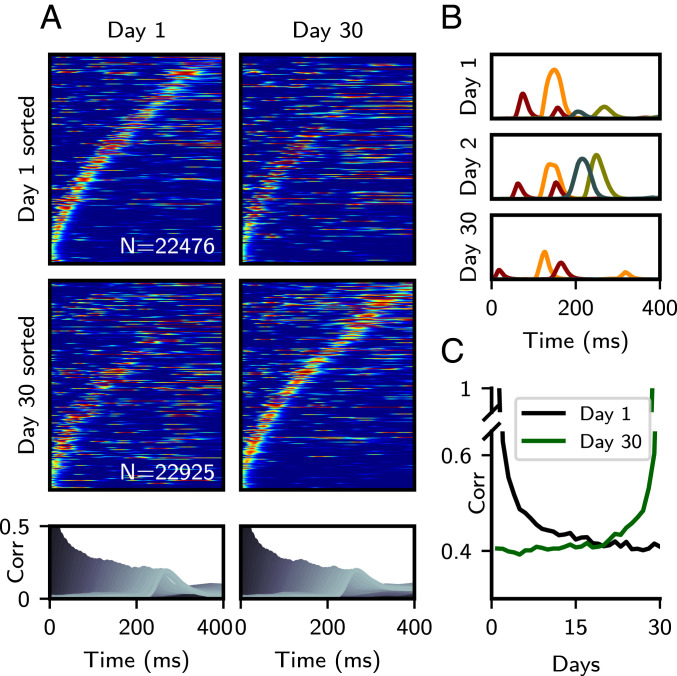
Fig. 6.
Changes in synaptic connectivity preserve retrieval while changing single-neuron dynamics. (A) Sorted raster plots at the start and end of a 30-d simulation. (A, Top) Sorted to activity on day 1. (A, Middle) Sorted to activity on day 30. (A, Bottom) Pattern correlations computed on day 1 and 30. (B) Representative single-unit activity profiles of four neurons across days 1, 2, and 30. Color corresponds to unit identity. (C) Average correlation of activity profiles between day n, and either day 1 (black) or 30 (green). , , and all other parameters as in Fig. 4. Note that the SD of the “noise” term in the connectivity matrix is larger than the SD of the fixed sequential component . The colormap scale for days 1 and 30 in A are the same as in Fig. 5.

