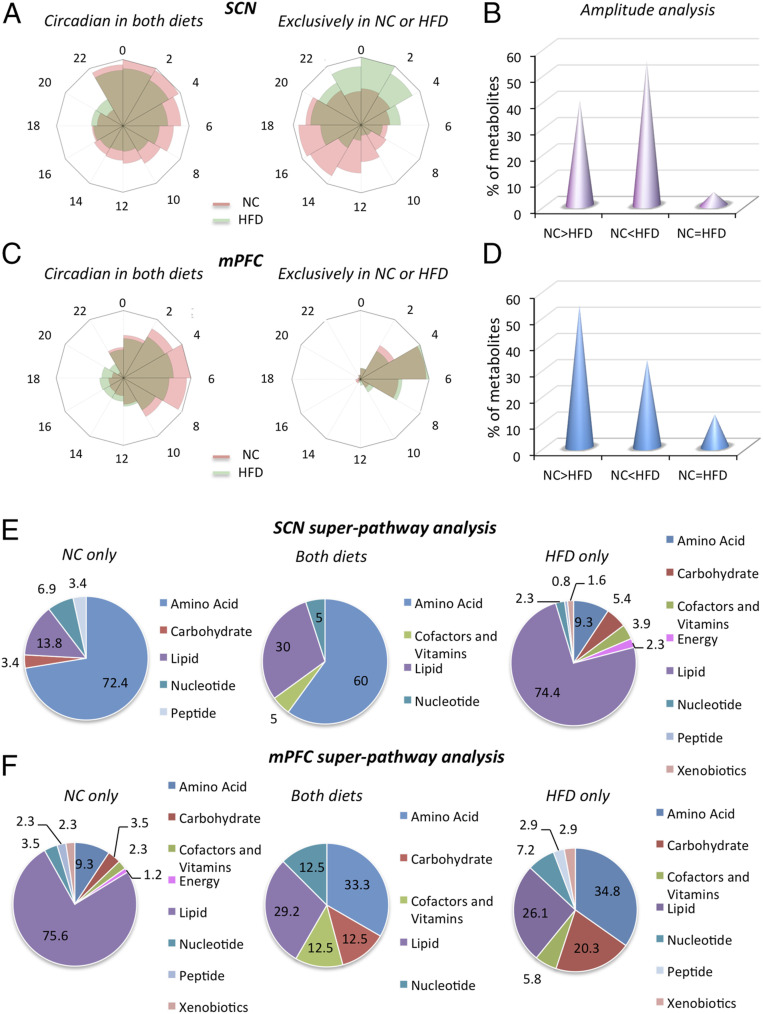
Fig. 2.
The HFD influences the phase, amplitude, and class of oscillatory metabolites in a brain region-specific manner. (A) Radar plots representing the phase distribution of metabolites circadian in both NC and HFD (first plot) and exclusively circadian in NC and HFD (second plot) in the SCN (exclusive plot: Anderson–Darling test, phase distribution significance P < 0.0001). (B) Amplitude analysis of metabolites circadian in both diets in the SCN showing the percentages of metabolites with amplitude lower, higher, or equal with respect to NC condition. (C) Radar plots representing the phase of metabolites circadian in both NC and HFD (first plot) and exclusively circadian in the NC and HFD (second plot) in the mPFC. (D) Amplitude analysis of metabolites circadian in both diets in the mPFC, showing the percentages of metabolites with amplitude lower, equal, or higher with respect to the NC diet. (E) Superpathway analysis of oscillatory metabolites in the NC-only, both diets, and HFD-only groups in the SCN, showing the percentages of the different classes out of the total number of circadian metabolites for each specific condition. (F) Superpathway analysis of oscillatory metabolites in the mPFC in the NC-only, both diets, and HFD-only groups. The pie chart represents the % of the different classes out of the total number of circadian metabolites for each specific condition.

