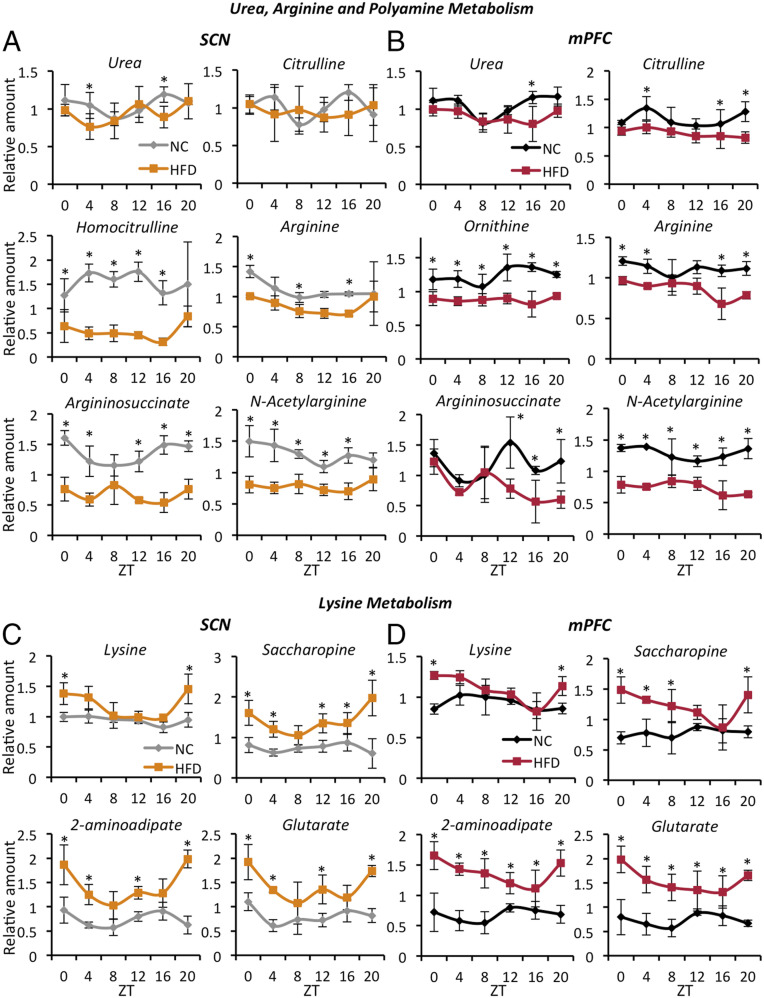
Fig. 3.
Diurnal metabolic pathways impacted by HFD in both the SCN and the mPFC. (A) SCN: representative oscillatory metabolites from the urea and arginine metabolism pathways. (B) mPFC: representative oscillatory metabolites from the urea and arginine metabolism pathways. Metabolites belonging to the same pathways and intersecting with the urea cycle are also represented (n = 3 to 5 per time point per group; CyberT test, *P < 0.05). (C) SCN: representative oscillatory metabolites from the lysine catabolic pathway. (D) mPFC: representative oscillatory metabolites from the lysine catabolic pathway. Metabolites belonging to the same pathway are also represented (n = 3 to 5 per time point per group; CyberT test, *P < 0.05). Error bars represent SD.

