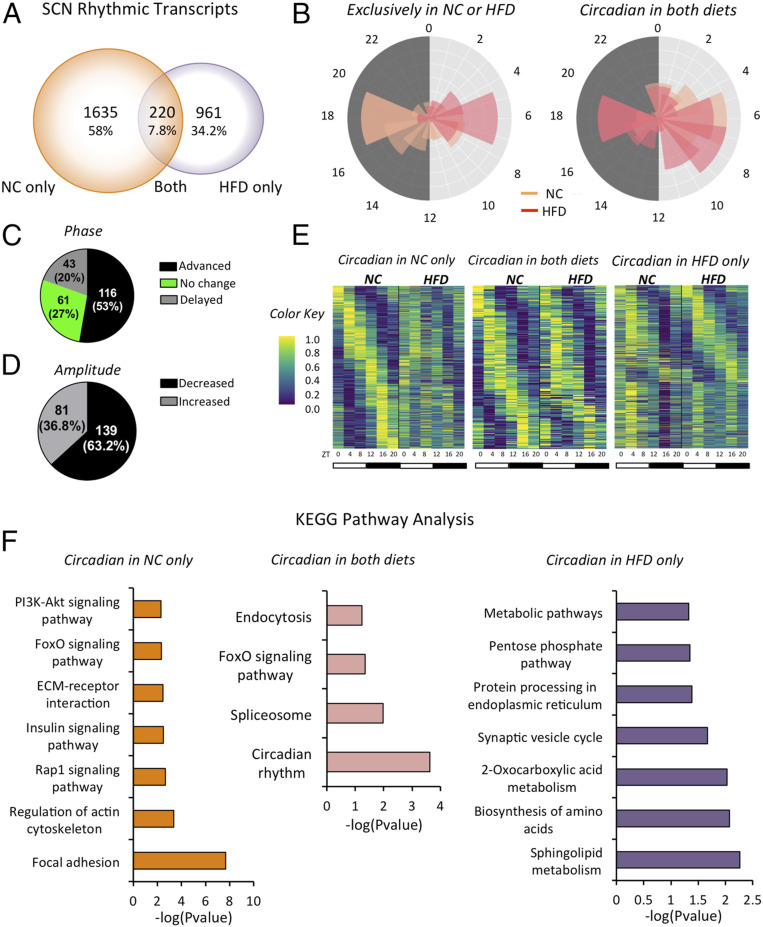
Fig. 5.
Impact of HFD feeding on the SCN circadian transcriptome. (A) Venn diagram showing the number and percentage of rhythmic transcripts in the SCN in the NC-only, both diets, and HFD-only groups (JTK_CYCLE, P < 0.05). (B) Radar plots representing the phase of transcripts exclusively circadian in NC and HFD (first plot) and in both NC and HFD (second plot) in the SCN. (C) Analysis of transcripts circadian in both conditions and phase advanced or delayed in HFD feeding with respect to NC feeding. (D) Amplitude analysis of genes circadian in both diets in the SCN, showing the percentage of genes with amplitude lower or higher with the HFD with respect to the NC diet. (E) Heat maps representing the transcripts circadian in the SCN in the NC-only, both diets, and HFD-only groups (n = 3 per time point per group; JTK_CYCLE, P < 0.05). (F) KEEG pathway analysis of rhythmic transcripts in the NC-only, both diets, and HFD-only groups. The x-axis reports the –log of the P value.

