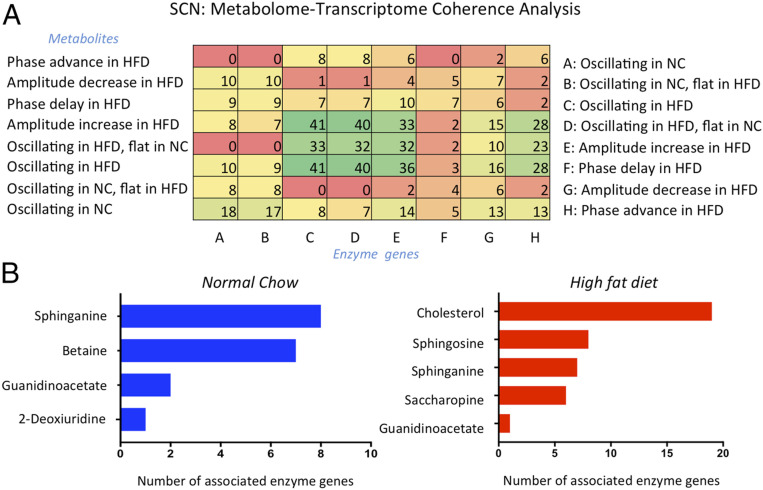
Fig. 6.
Coherence between the circadian transcriptome and metabolome in the SCN. (A) Heat map representing the relationship between oscillating metabolites and corresponding enzymes (transcripts), obtained by crossing transcriptome and metabolome data in the SCN. (B) Graphs representing the number of oscillating enzymes for each reported circadian metabolite in the NC and HFD groups.

