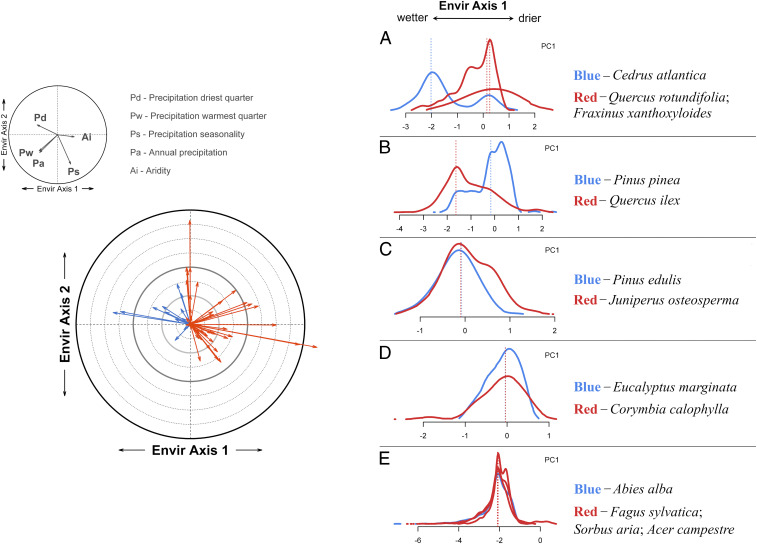
Fig. 5.
Community bioclimatic shift as a result of forest mortality associated with drought. (Left) Relative change within the environmental space defined by precipitation regime and aridity. Environmental axes 1 and 2 encompass 82.4% of the variability of individual variables (PCA-derived axes). Each arrow represents the bioclimatic shift for a given forest site computed as the difference between the bioclimatic centroids of the dominant (predrought) and the replacing woody species weighted by the relative abundance of each species at the site. Orange and blue arrows illustrate shifts toward more xeric and more mesic communities, respectively. (Right) From A to E are examples of bioclimatic niches of the predrought dominant (blue) and postdrought replacing (red) species. Solid lines show the abundance and distribution range of each species along environmental axis 1, whereas the dotted vertical lines correspond to the species’ bioclimatic optima (center of mass of the distribution).

