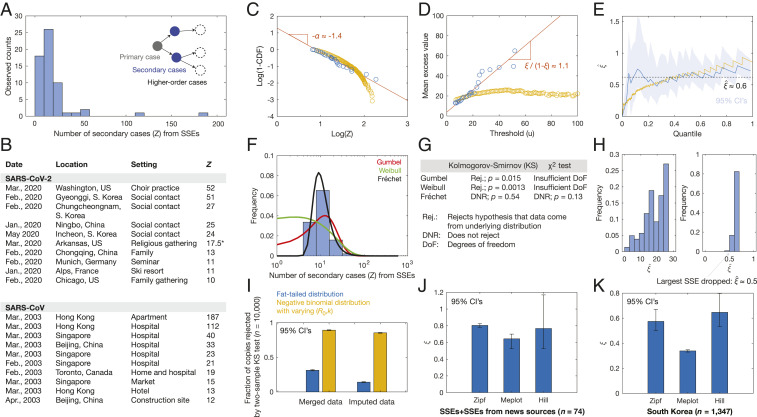
Fig. 1.
SARS-CoV and SARS-CoV-2 SSEs correspond to fat tails. (A) Histogram of Z for 60 SSEs. (B) Subsample of 20 diverse SARS-CoV and SARS-CoV-2 SSEs. *See Dataset S1 for details. (C) Zipf plots of SSEs (blue) and 10,000 samples of a negative binomial distribution with parameters (R0,k) = (3,0.1), conditioned on Z > 6 (yellow). (D) Meplots corresponding to C. (E) Plots of , the Hill estimator for ξ, for the samples in C. (F) Different extreme value distribution fits to the distribution of SSEs. (G) One-sample Kolmogorov–Smirnov and χ2 goodness-of-fit test results for the fits in F. (H) Robustness of results, accounting for noise (Left) and incomplete data (Right). (I) Inconsistency of the maxima of 10,000 samples of a negative binomial distribution (yellow) with the SSEs in A, accounting for variability in (R0,k) and data merging and imputation, in contrast to the maxima of 30 samples from a fat-tailed (Fréchet) distribution (blue) with tail parameter α = 1.7 and mean R0 = 3. The numbers of samples in each case were determined so that the sample mean of maxima is equal to the sample mean from A. (J–K) Generality of inferred ξ to 14 additional SSEs from news sources (J) and a dataset of 1,347 secondary cases arising from 5,165 primary cases in South Korea (K) (Dataset S2).

