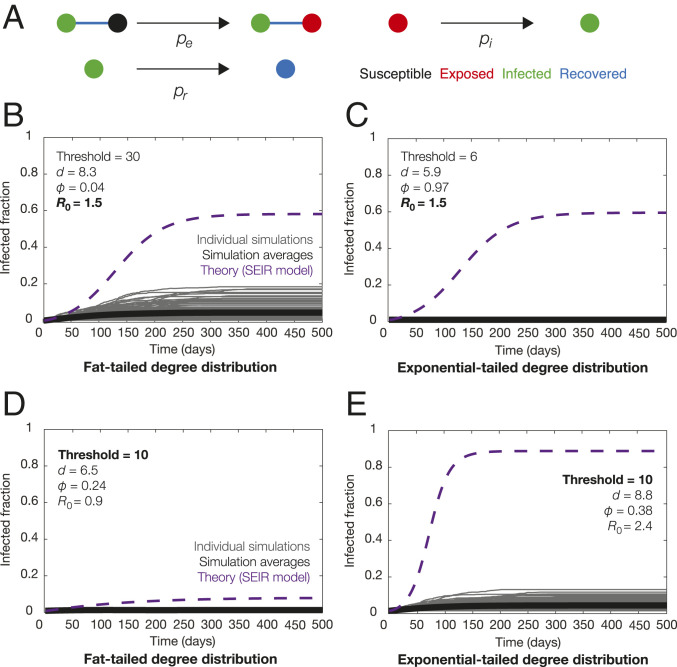
Fig. 2.
Forward modeling of intervention strategies. (A) State transitions in a fine-grained network model of disease transmission. (B–E) Predicted total infected fraction for an intervention strategy that isolates a fraction φ of all individuals, namely those with degree greater than the threshold number, and yielding decreased mean connectivity of d and effective basic reproduction number of R0. Here, R0 depends on the coefficient of variation of the degree distribution, as detailed in Dataset S3. Trajectories from 100 simulations for BA random graphs (B and D) and WS random graphs (C and E) and their averages are shown, compared to the theoretical predictions for a well-mixed model.

