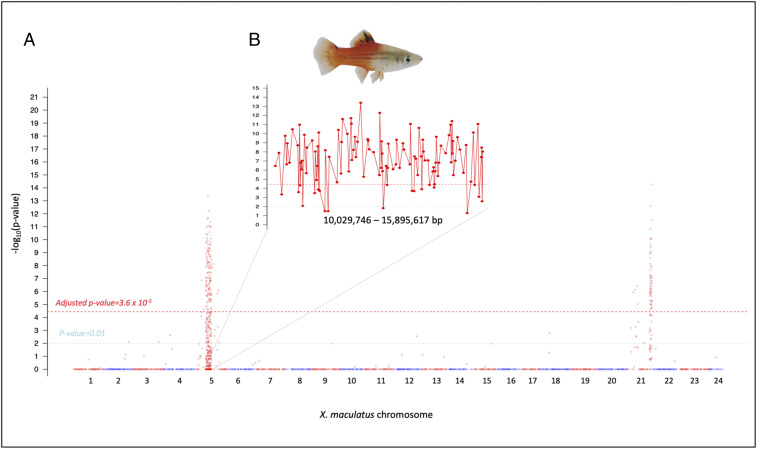
Fig. 2.
Genetic mapping of heterozygous loci in advanced BC hybrids. A total 90 BC hybrids (BC2 to BC8) that exhibited dorsal fin melanocyte benign hyperplasia and were produced by crossing cdkn2ab genotyped hybrid (cdkn2abX. mac/X. hel) with X. hellerii (cdkn2abX. hel/X. hel). (A) Manhattan plot showing –log10P value (χ2 test) across the genome. The y axis represents –log10P value and the x axis represents amplicon chromosomal coordinates, which are labeled as red or blue. Only the −log10 P value of loci that exhibited higher X. maculatus allele frequency is plotted due to introgression. The light blue dashed line represents a P value of 0.01 that is suggestive of statistical significance. χ2 test P values were corrected using Bonferroni method across the genome-wide data. The red dashed line represents adjusted P value of 0.05 corresponding to 3.6 × 10⁻⁵. (B) A zoom-in view of the chromosome 5 10,029,746- to 15,895,617-bp region. This region is highly correlated to the pigmentation phenotype observed in BC hybrids.

