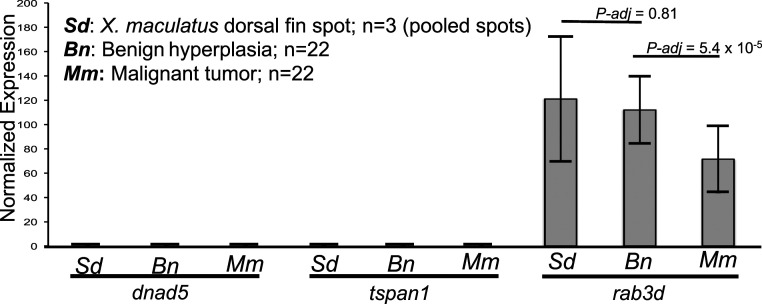
Fig. 4.
Gene expression profiling of the R(Diff) locus. Bar graph showing dnad5, tspan1, and rab3d expression in X. maculatus dorsal fin spots (Sd), benign hyperplasia (Bn), and malignant tumors (Mm) of BC hybrids. The y axis represents library size-normalized read counts. Error bars represent SD. Differential expression analyses between different genotypes were performed using DESeq2, and P values are corrected using FDR.

