
Fig. 1.
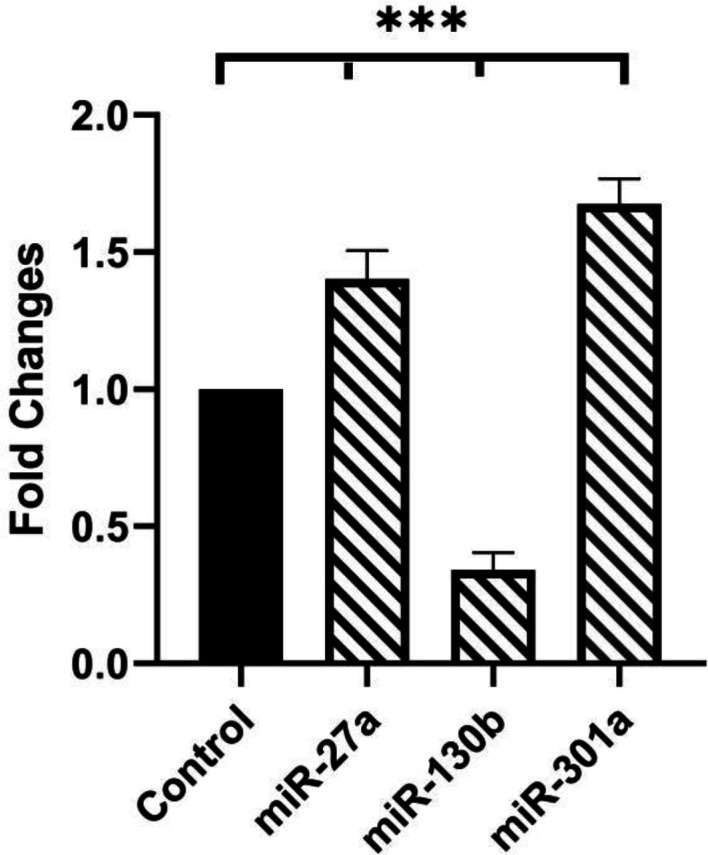
Investigation of miRNAs expressions. The data from the real-time PCR was normalized versus SNORD47. MiR-27a and miR-301a expression levels significantly increased (fold changes: 1.50 and 1.77; P = 0.0008 and P < 0.0001, respectively) in patients in comparison with controls, miR-130b expression had a noticeable decrease (fold change: 0.41; P < 0.0001). The One-way ANOVA was used to determine the normality of data distribution. MiRNAs expression was examined in triplicate, and the results are presented as mean ± SD. (***= P < 0.001). Significance level (P) was considered ≤ 0.05