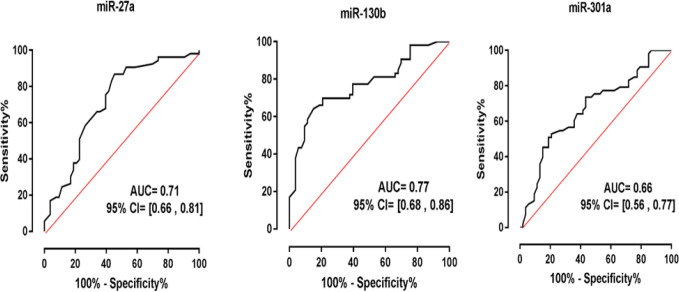
Fig. 2.
ROC curve analysis of miR-27a, miR-130b, and miR-301a to discriminate women with PCOS from healthy controls. Based on the ROC analyzes, the areas under the curves (AUC) for miR-27a, miR-130b, and miR-301a were 0.71, 0.77 and 0.66, respectively. The highest sensitivity and specificity were considered to be the optimal diagnostic point, according to which miR-27a had far more efficiency for the diagnosis of PCOS

