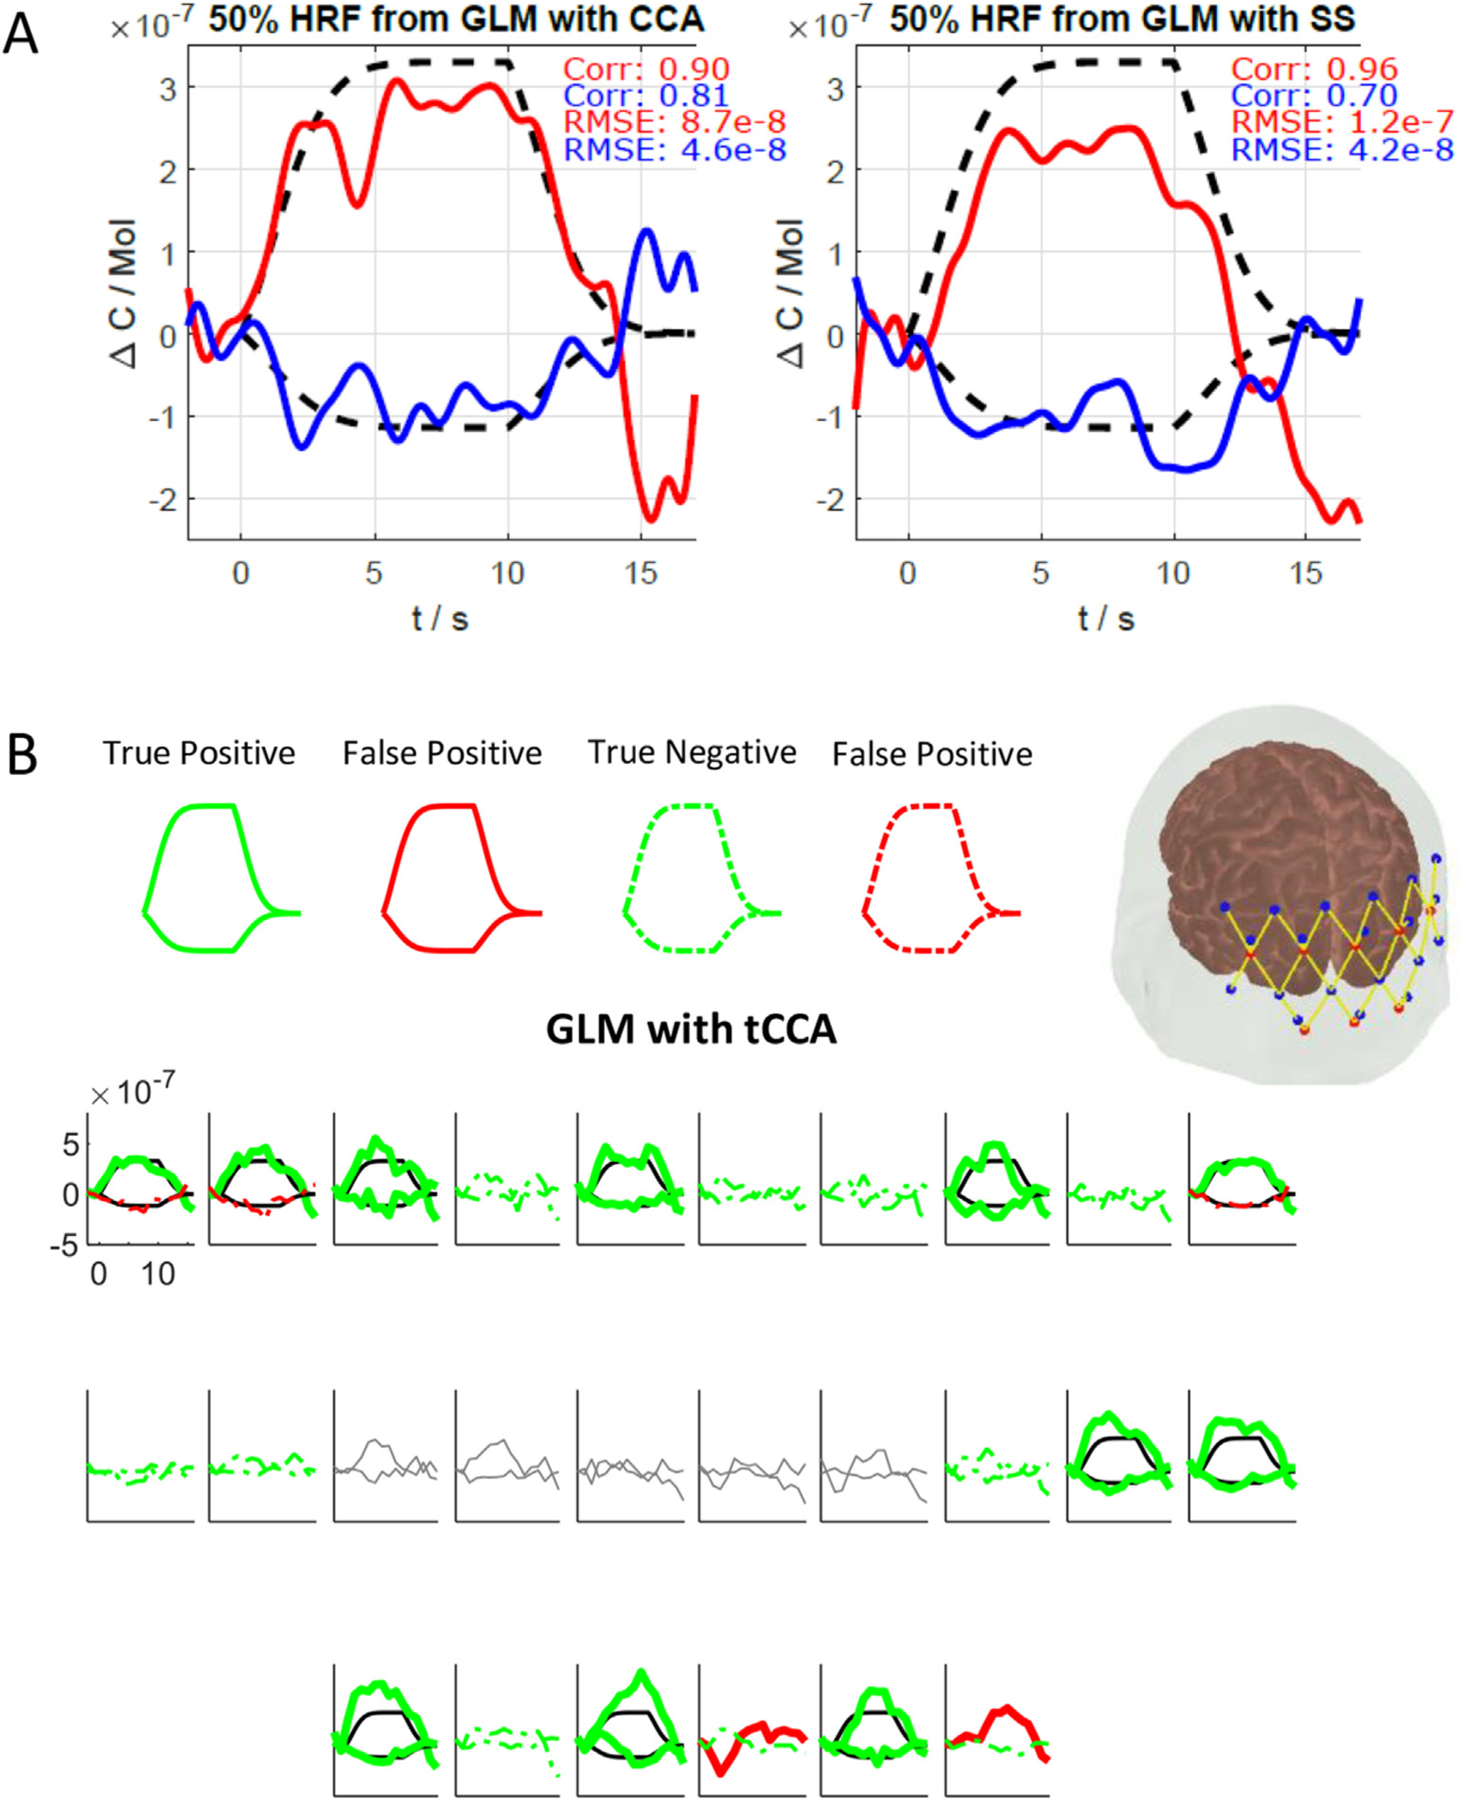
Fig. 2.

(A) Single channel across trial average HRF example from subject 4, Ch34 (HbO: red, HbR: blue) and ground truth (black dashed). Left: new tCCA GLM, right: conventional SS GLM. (B) Estimated HRF and corresponding statistics obtained using GLM with tCCA. The channels that are true positive (bold) and true negative (dashed) are shown in green. Channels that are false positive (bold) and false negative (dashed) are shown in red. The true HRF (black lines) and pruned channels (grey lines) are also shown.
