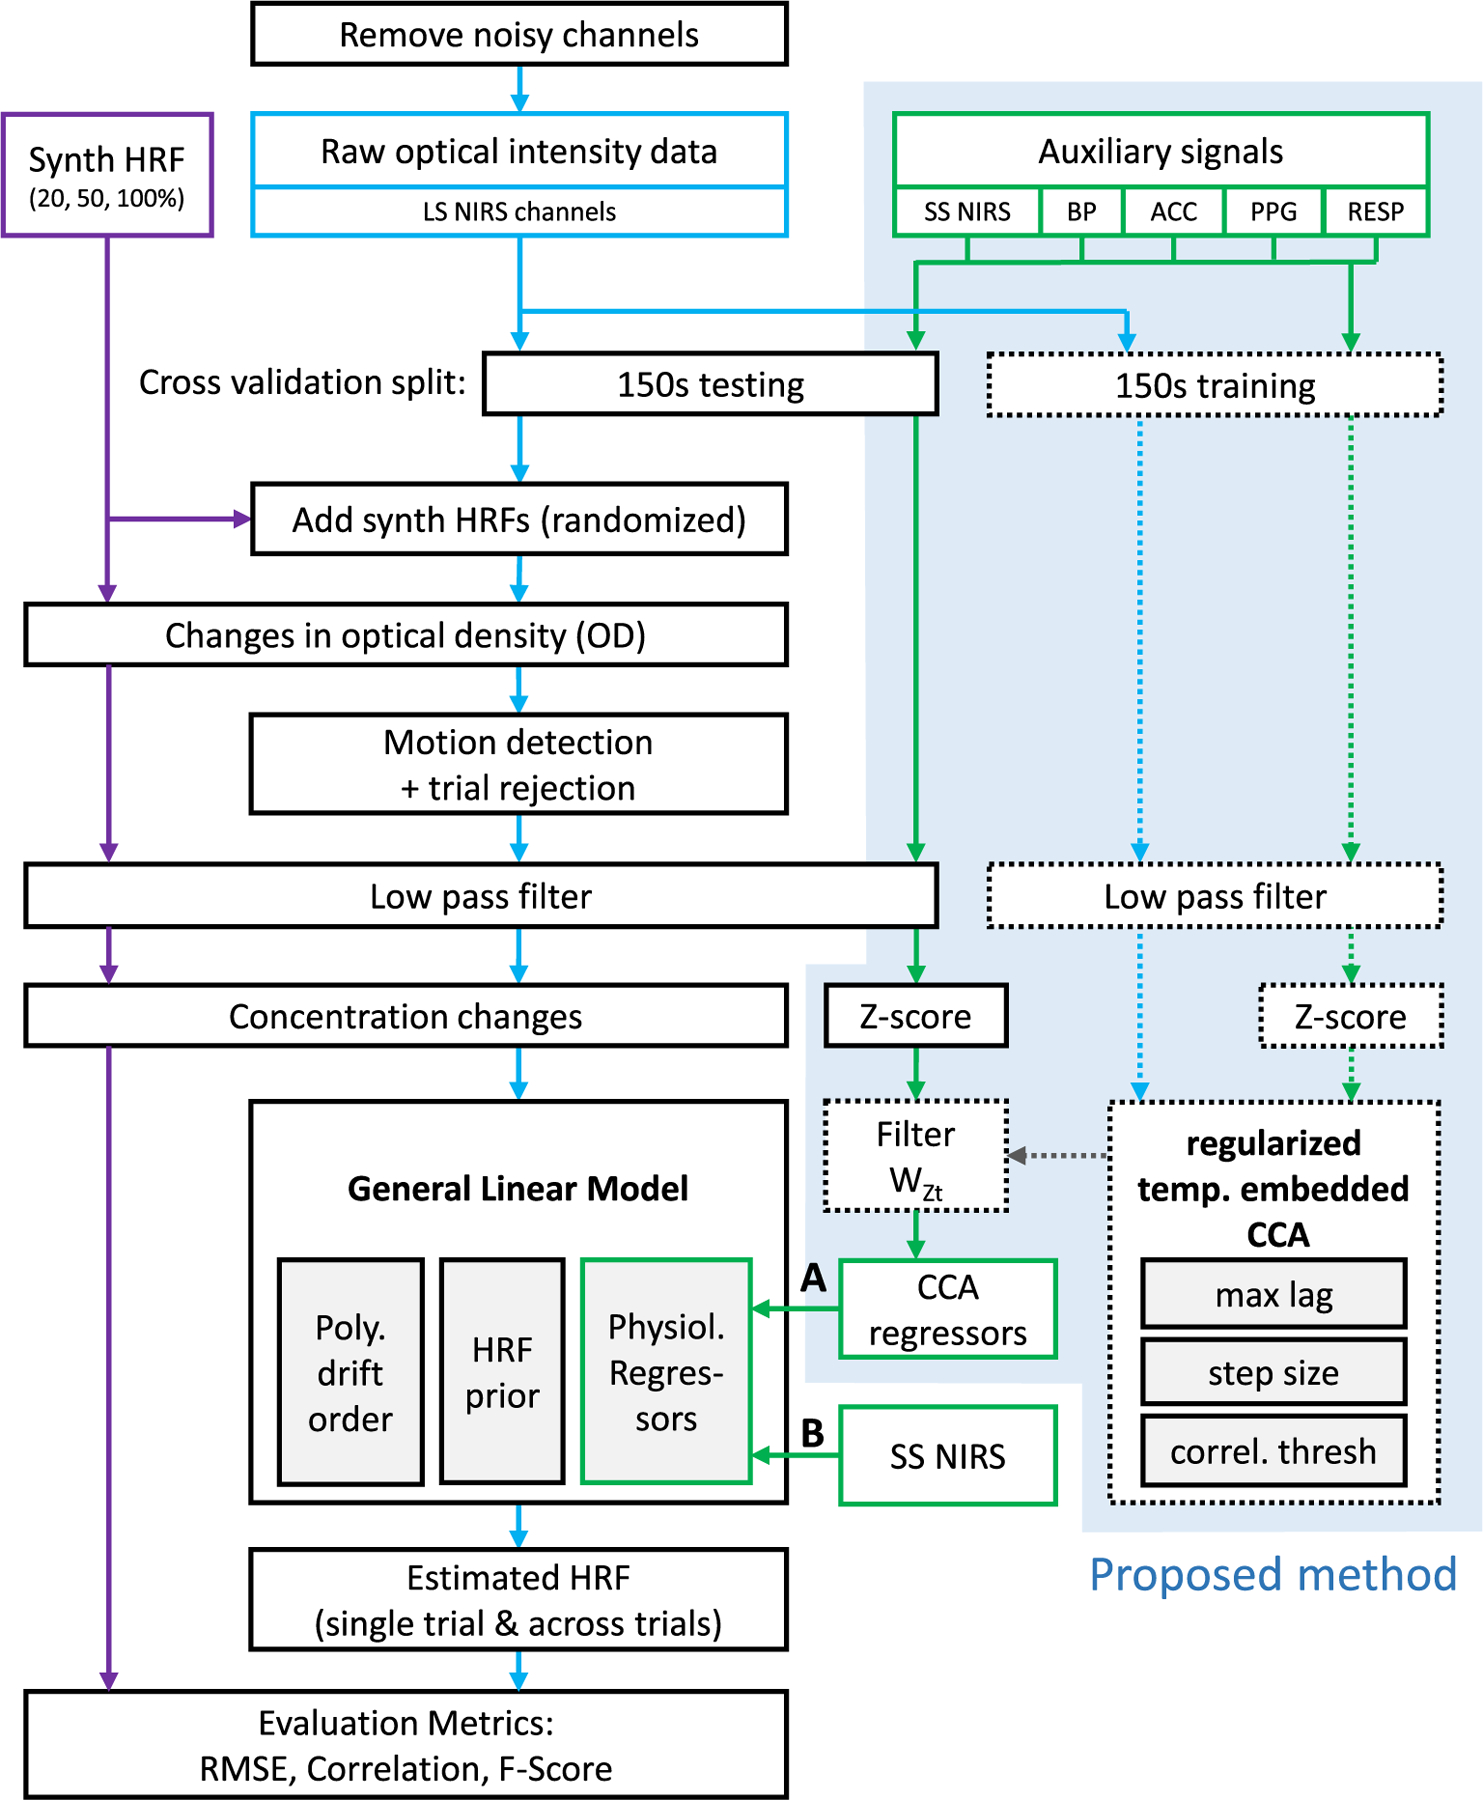
Fig. 3.

Diagram of evaluation pipeline. Blue: fNIRS signals. Green: Auxiliary signals. Solid lines: testing data. Dashed lines: training data. Blue box: proposed method (A). We use temporally embedded CCA with a variety of auxiliary signals to provide physiological nuisance regressors for the GLM. (B) state of the art approach using short-separation NIRS signals only. HRF: Hemodynamic Response Function, SS: Short Separation, LS: Long Separation, BP: Blood Pressure, ACC: Acceleration, PPG: Photo plethysmography, RESP: Respiration. Please note that SS NIRS signals fed into GLM with SS and with tCCA were previously converted to concentration changes analogous to LS NIRS channels.
