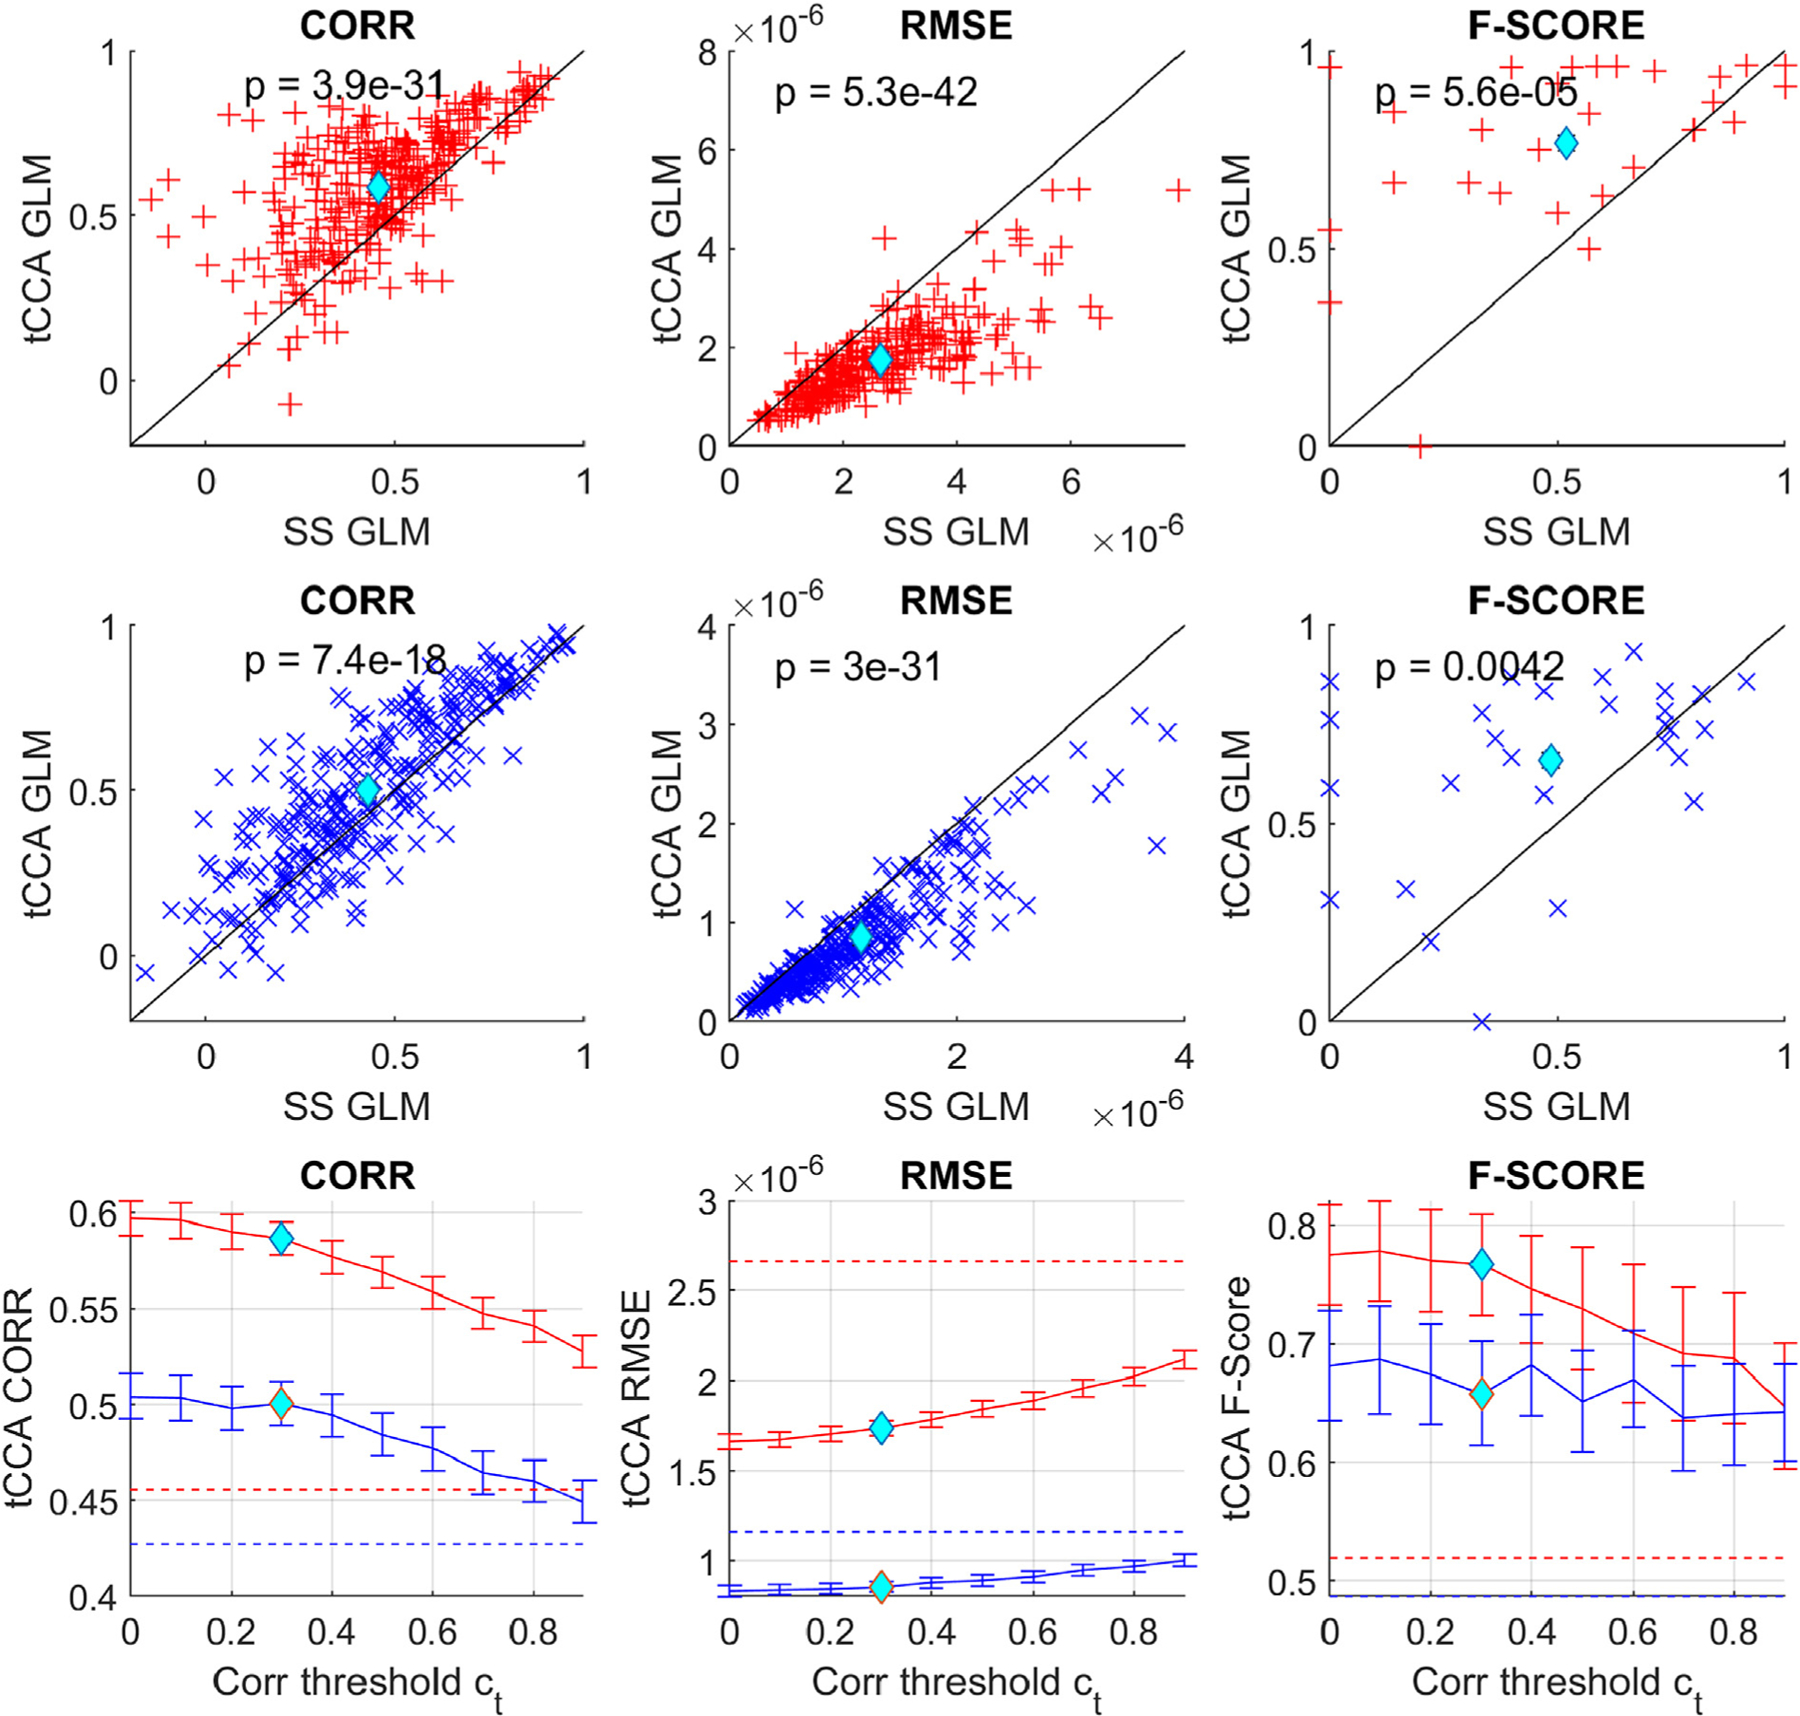
Fig. 9.

First two rows: Scatter plots comparing MSE/Corr/F-score performance metrics for GLM with SS and GLM with tCCA using 50% HRF amplitude data. Each data point marks the average result of all recovered single trial HRFs across a single channel and subject, as depicted in Fig. 2. Red: HbO, blue: HbR, cyan diamond: average. Bottom row: solid line shows grand average and standard error of all metrics for GLM with tCCA with fixed optimal time lag and time steps vs. the correlation threshold. Dotted lines are the results for the standard GLM with SS.
