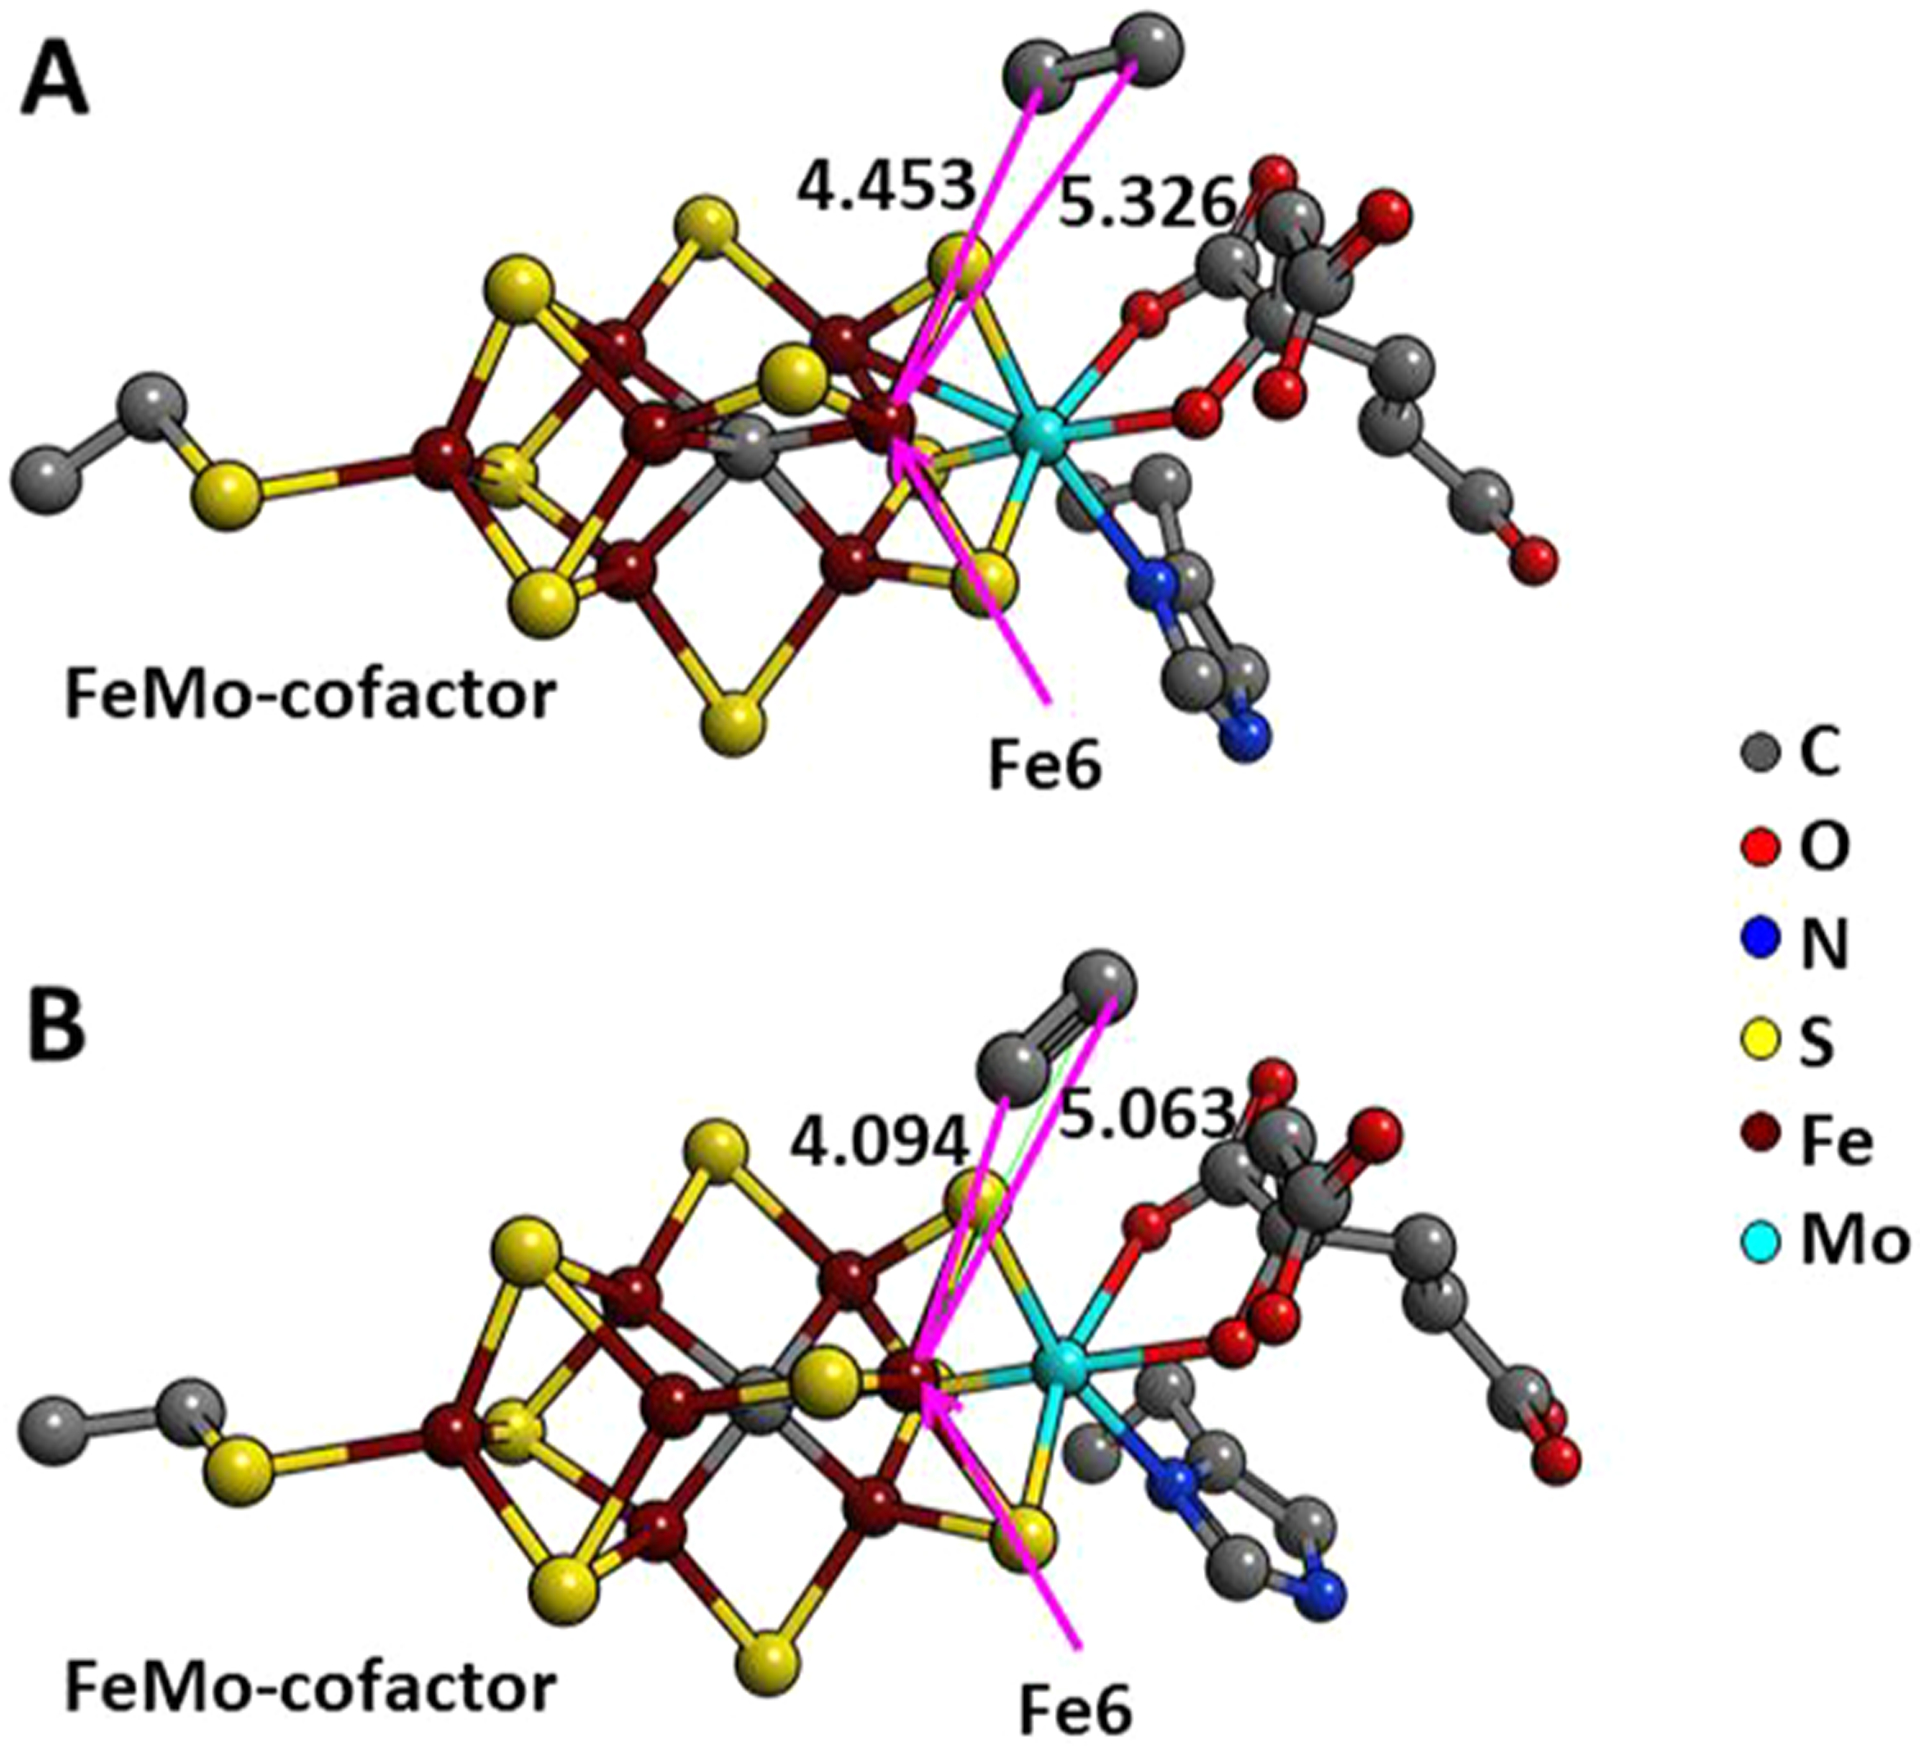
Figure 22.

Comparison of the acetylene location at the FeMo-cofactor. The acetylene location at the FeMo-cofactor is compared between X-ray (A) and DFT optimized structures (B). The interatomic distances are shown with red lines. Reproduced with permission 215. Copyright 2017 Elsevier, Ltd.
