
Table 5.
In Vitro AR Activity of 29a–29f (Series IV)
| ID (R1) | Linker | Binding (Ki) / Transactivation (IC50) (μM) | SARD Activity (% degradation) | F.L. DC50 (μM) | ||
|---|---|---|---|---|---|---|
| Ki (DHT = 1 nM)a | IC50a | Full Lengtha (LNCaP) at 1 μM, 10 μM | Splice Varianta (22RV1) at 10 μM | |||
| 29a (4-F) (R-isomer) | 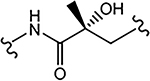 |
>10 | 0.192 | 84 | N.A.b | - |
| 29b (4-F) | 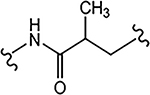 |
>10 | 0.462 | 60 | 70 | 0.74 |
| 29c (4-F) | 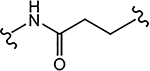 |
>10 | 2.124 | 35 | 40 | - |
| 29d (4-F) | 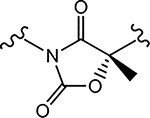 |
N.A.b | 1.131 | 18, 50c | N.A.b | - |
| 29e (4-NH2) |  |
>10 | 0.901 | N.A. | N.A. | - |
a
AR binding, transactivation, and degradation assays were performed and values are reported as described in Table 2.
b
N.A. indicates data not available.
c
The two values indicate SARD assays run with 1 and 10 μM of antagonist.